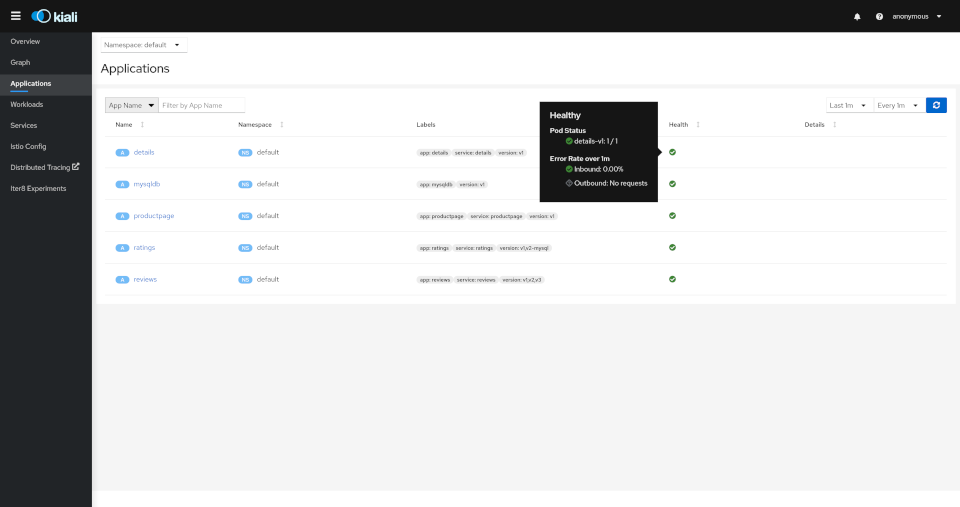
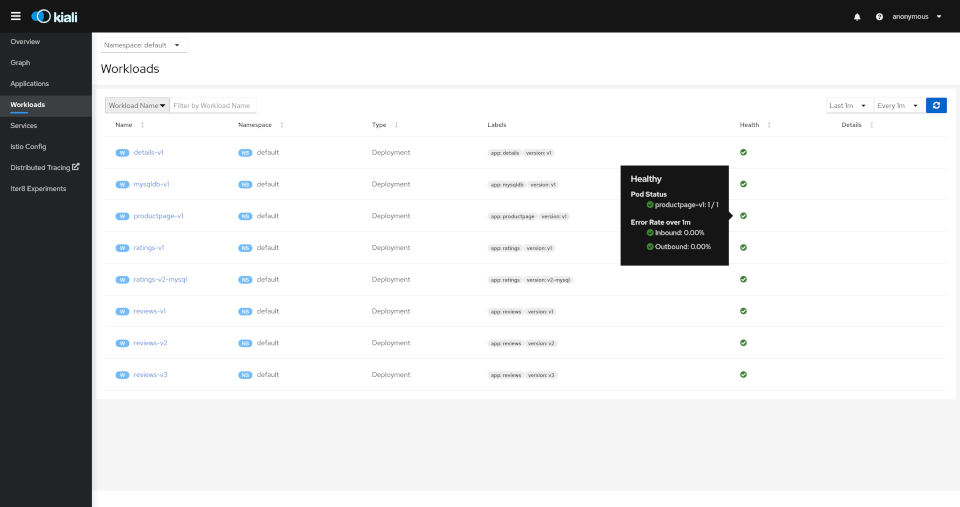
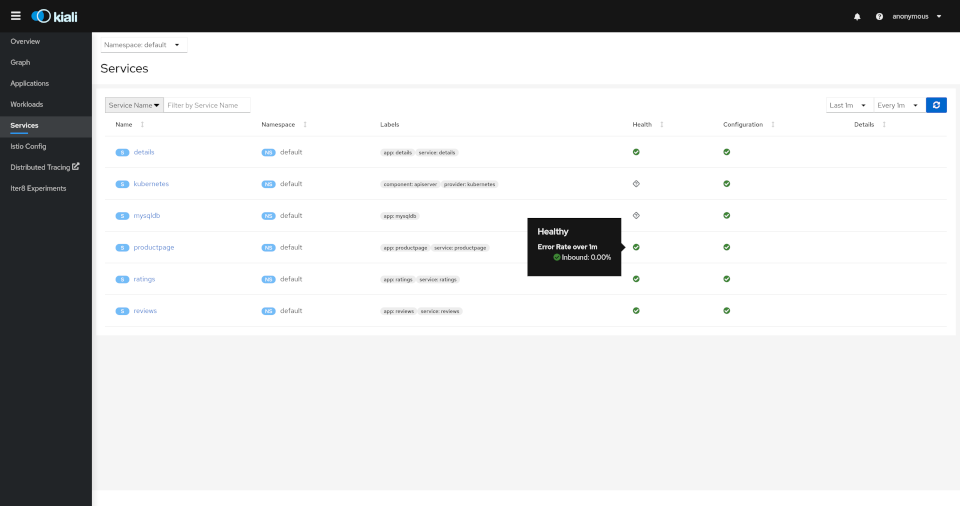
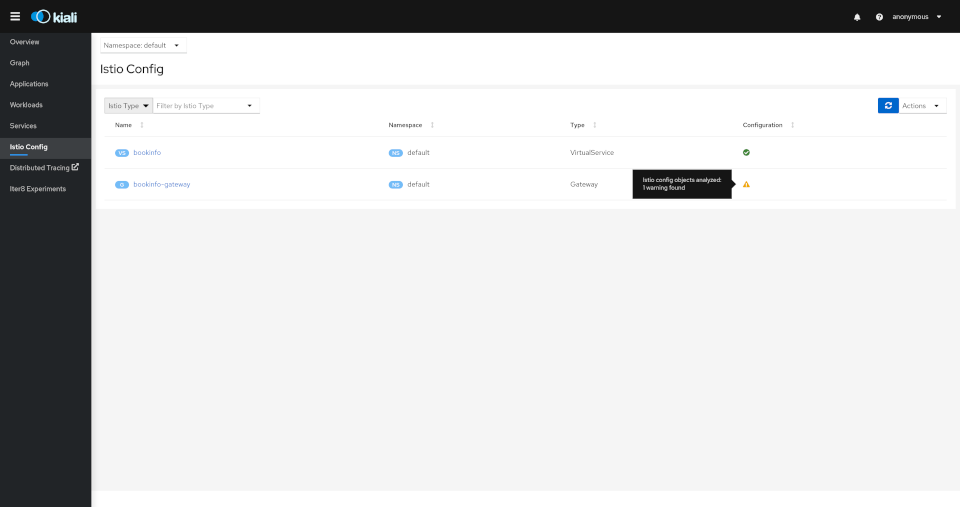
Details
Overview Tab
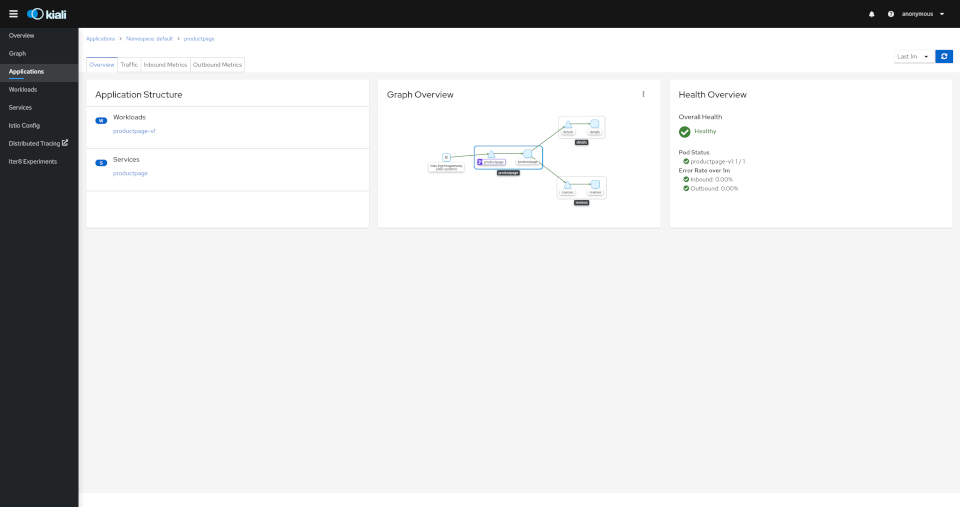
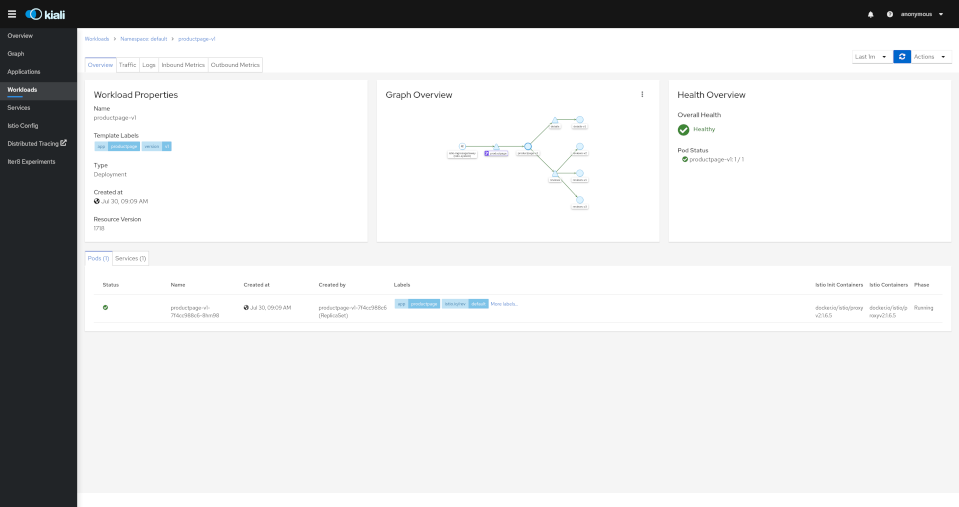
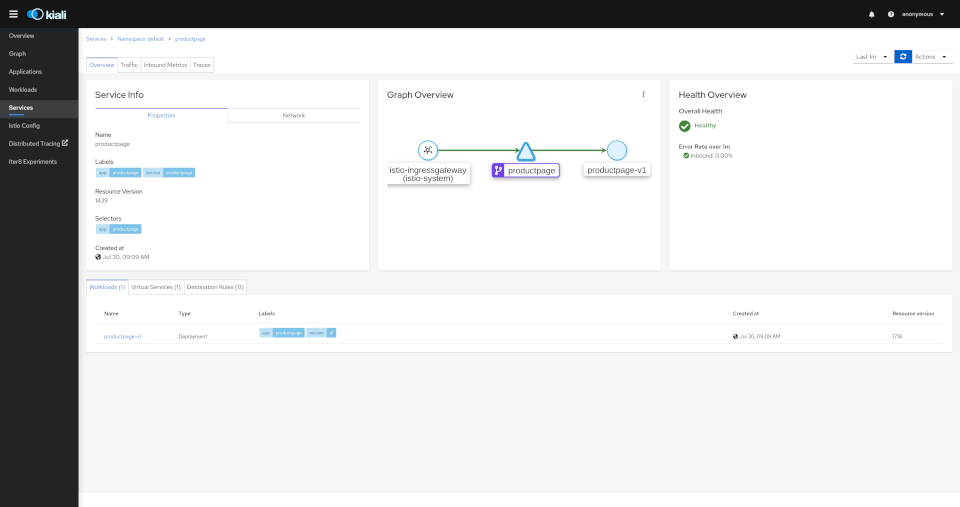
The overview tab provides detail information, a contextual graph and health overview for a specific Application, Workload or Service.
For each type of element, Kiali adds additional features.
In the Workload Overview, Kiali performs several validations on workload configuration:
-
Are Istio sidecars deployed?
-
Are proper app and version labels assigned?
Workload detail shows the services for which the workload in handling requests, and the pods backing them.
The Service Overview shows the workloads running the service. It also shows the Istio traffic routing configuration, VirtualServices and DestinationRules associated with the service.
Kiali provides access to YAML definitions and allows modification and deletion access for authorized users. It provides wizards to assist in common configurations and performs additional validation on VirtualServices to detect misconfigured routes.
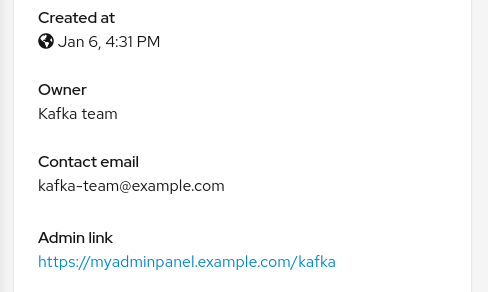
Both Workload and Service detail can be customized to some extent, by adding additional details supplied as annotations. This is done through the additional_display_details field in the Kiali CR or ConfigMap.
Metrics Dashboards
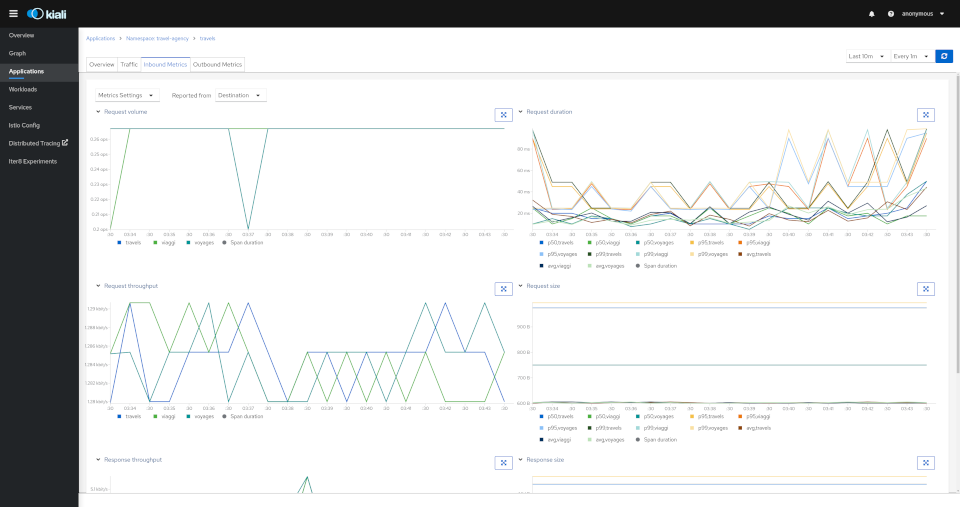
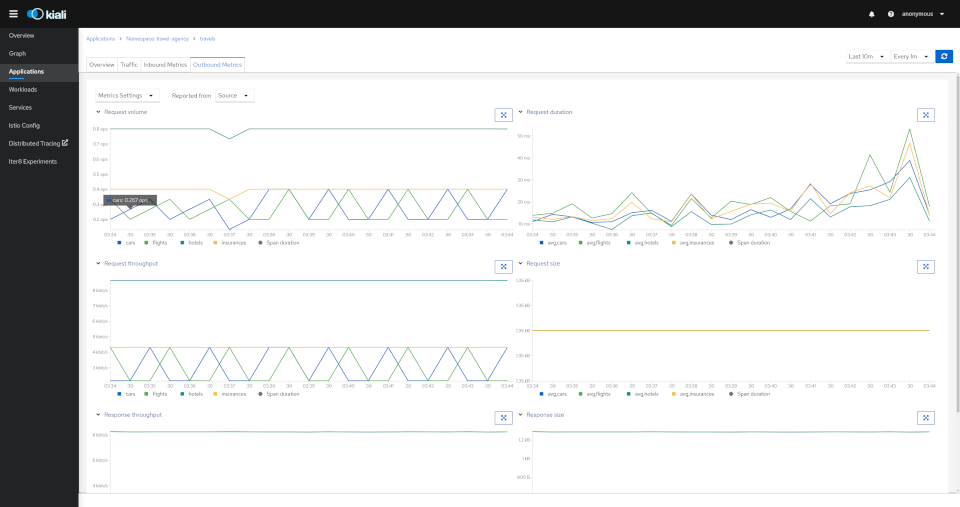
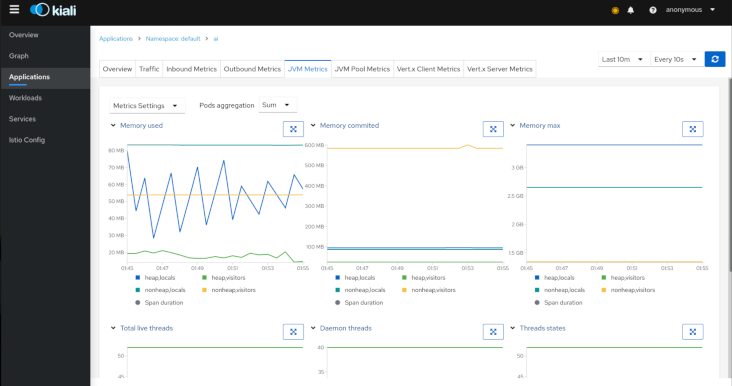
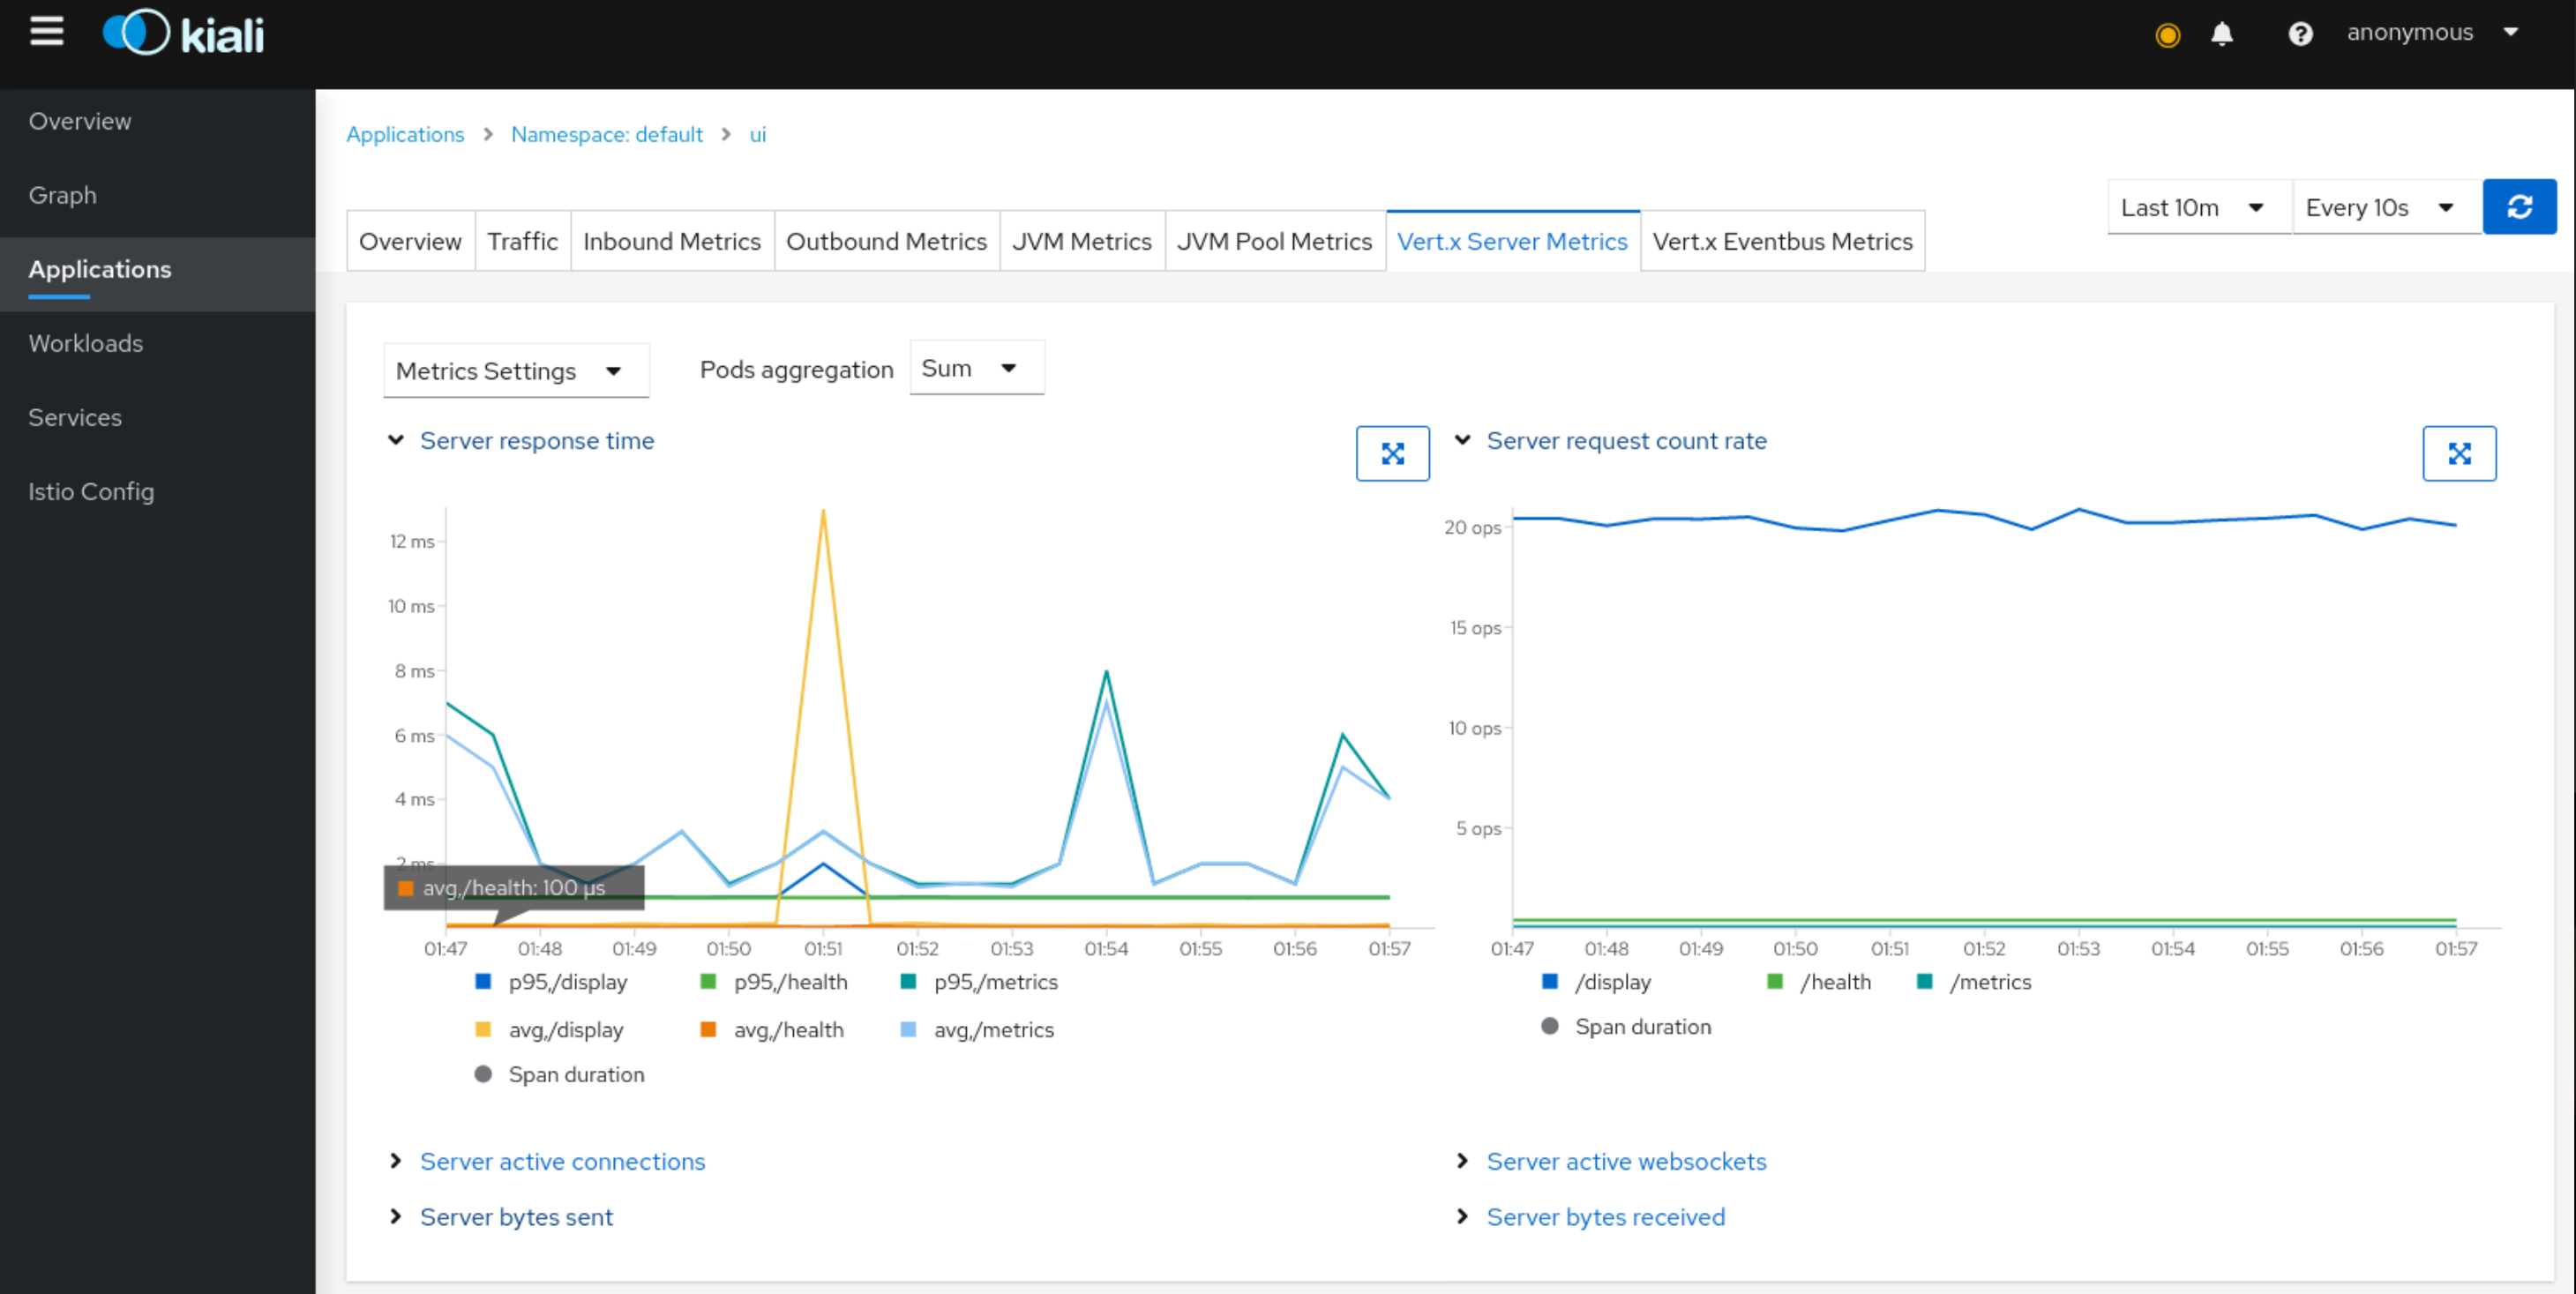
Each detail view provides predefined metric dashboards. The metric dashboards provided are tailored to the relevant application, workload or service level.
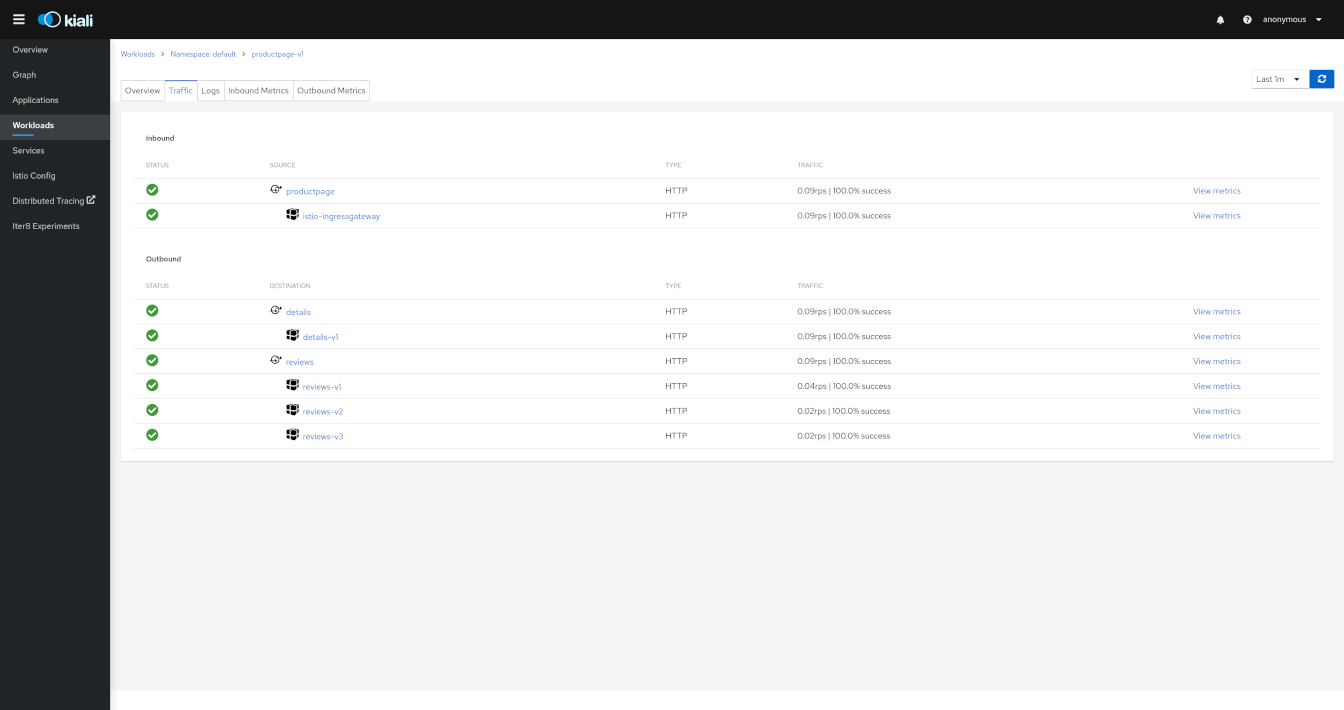
Application and workload detail views show request and response metrics such as volume, duration, size, or tcp traffic. The traffic can also be viewed for either inbound or outbound traffic.
The service detail view shows request and response metrics for inbound traffic.
Custom Dashboards
Kiali comes with built-in dashboards for several runtimes, including Go, Envoy, Node.js, and others.
You can create custom dashboards for your own applications by defining them within the Kiali CR field spec.custom_dashboards.
Prometheus Configuration
Kiali custom dashboards work exclusively with Prometheus, so it must be configured correctly to pull your application metrics.
If you are using the demo Istio installation with addons, your Prometheus instance should already be correctly configured and you can skip to the next section; with the exception of Istio 1.6.x where you need customize the ConfigMap, or install Istio with the flag --set meshConfig.enablePrometheusMerge=true.
Using another Prometheus instance
You can use a different instance of Prometheus for these metrics, as opposed to Istio metrics. This second Prometheus instance can be configured from the Kiali CR when using the Kiali operator, or ConfigMap otherwise:
# ...
external_services:
  custom_dashboards:
    prometheus:
      url: URL_TO_PROMETHEUS_SERVER_FOR_CUSTOM_DASHBOARDS
    namespace_label: kubernetes_namespace
  prometheus:
    url: URL_TO_PROMETHEUS_SERVER_FOR_ISTIO_METRICS
# ...
For more details on this configuration, such as Prometheus authentication options, check this page.
You must make sure that this Prometheus instance is correctly configured to scrape your application pods and generates labels that Kiali will understand. Please refer to this documentation to setup the kubernetes_sd_config section. As a reference, here is how it is configured in Istio.
It is important to preserve label mapping, so that Kiali can filter by app and version, and to have the same namespace label as defined per Kiali config. Here’s a relabel_configs that allows this:
      relabel_configs:
      - action: labelmap
        regex: __meta_kubernetes_pod_label_(.+)
      - source_labels: [__meta_kubernetes_namespace]
        action: replace
        target_label: kubernetes_namespace
Pods Annotations and Auto-discovery
Application pods must be annotated for the Prometheus scraper, for example, within a Deployment definition:
spec:
  template:
    metadata:
      annotations:
        prometheus.io/scrape: "true"
        prometheus.io/port: "8080"
prometheus.io/path: "/metrics"-
prometheus.io/scrape tells Prometheus to fetch these metrics or not
-
prometheus.io/port is the port under which metrics are exposed
-
prometheus.io/path is the endpoint path where metrics are exposed, default is /metrics
Kiali will try to discover automatically dashboards that are relevant for a given Application or Workload. To do so, it reads their metrics and try to match them with the discoverOn field defined on dashboards.
But if you can’t rely on automatic discovery, you can explicitly annotate the pods to associate them with Kiali dashboards.
spec:
  template:
    metadata:
      annotations:
        # (prometheus annotations...)
        kiali.io/dashboards: vertx-server
kiali.io/dashboards is a comma-separated list of dashboard names that Kiali will look for. Each name in the list must match the name of a built-in dashboard or the name of a custom dashboard as defined in the Kial CR’s spec.custom_dashboards.
Built-in dashboards
Kiali comes with a set of built-in dashboards for various runtimes.
Go
Contains metrics such as the number of threads, goroutines, and heap usage. The expected metrics are provided by the Prometheus Go client.
Example to expose built-in Go metrics:
        http.Handle("/metrics", promhttp.Handler())
        http.ListenAndServe(":2112", nil)
As an example and for self-monitoring purpose Kiali itself exposes Go metrics.
The pod annotation for Kiali is: kiali.io/dashboards: go
Envoy
Istio’s Envoy sidecars supply some internal metrics, that can be viewed in Kiali. They are different than the metrics reported by Istio Telemetry, which Kiali uses extensively. Some of Envoy’s metrics may be redundant.
Unlike the other custom dashboards, there is no automatic discovery configured for Envoy. You must explicitly enable the Envoy dashboard with the pod annotation kiali.io/dashboards: envoy.
Note that the enabled Envoy metrics can be tuned, as explained in the Istio documentation: it’s possible to get more metrics using the statsInclusionPrefixes annotation. Make sure you include cluster_manager and listener_manager as they are required.
For example, sidecar.istio.io/statsInclusionPrefixes: cluster_manager,listener_manager,listener will add listener metrics for more inbound traffic information. You can then customize the Envoy dashboard of Kiali according to the collected metrics.
Node.js
Contains metrics such as active handles, event loop lag, and heap usage. The expected metrics are provided by prom-client.
Example of Node.js metrics for Prometheus:
const client = require('prom-client');
client.collectDefaultMetrics();
// ...
app.get('/metrics', (request, response) => {
  response.set('Content-Type', client.register.contentType);
  response.send(client.register.metrics());
});
Full working example: https://github.com/jotak/bookinfo-runtimes/tree/master/ratings
The pod annotation for Kiali is: kiali.io/dashboards: nodejs
Quarkus
Contains JVM-related, GC usage metrics. The expected metrics can be provided by SmallRye Metrics, a MicroProfile Metrics implementation. Example with maven:
    <dependency>
      <groupId>io.quarkus</groupId>
      <artifactId>quarkus-smallrye-metrics</artifactId>
    </dependency>
The pod annotation for Kiali is: kiali.io/dashboards: quarkus
Spring Boot
Three dashboards are provided: one for JVM memory / threads, another for JVM buffer pools and the last one for Tomcat metrics. The expected metrics come from Spring Boot Actuator for Prometheus. Example with maven:
    <dependency>
      <groupId>org.springframework.boot</groupId>
      <artifactId>spring-boot-starter-actuator</artifactId>
    </dependency>
    <dependency>
      <groupId>io.micrometer</groupId>
      <artifactId>micrometer-core</artifactId>
    </dependency>
    <dependency>
      <groupId>io.micrometer</groupId>
      <artifactId>micrometer-registry-prometheus</artifactId>
    </dependency>
Full working example: https://github.com/jotak/bookinfo-runtimes/tree/master/details
The pod annotation for Kiali with the full list of dashboards is: kiali.io/dashboards: springboot-jvm,springboot-jvm-pool,springboot-tomcat
By default, the metrics are exposed on path /actuator/prometheus, so it must be specified in the corresponding annotation: prometheus.io/path: "/actuator/prometheus"
Thorntail
Contains mostly JVM-related metrics such as loaded classes count, memory usage, etc. The expected metrics are provided by the MicroProfile Metrics module. Example with maven:
    <dependency>
      <groupId>io.thorntail</groupId>
      <artifactId>microprofile-metrics</artifactId>
    </dependency>
Full working example: https://github.com/jotak/bookinfo-runtimes/tree/master/productpage
The pod annotation for Kiali is: kiali.io/dashboards: thorntail
Vert.x
Several dashboards are provided, related to different components in Vert.x: HTTP client/server metrics, Net client/server metrics, Pools usage, Eventbus metrics and JVM. The expected metrics are provided by the vertx-micrometer-metrics module. Example with maven:
    <dependency>
      <groupId>io.vertx</groupId>
      <artifactId>vertx-micrometer-metrics</artifactId>
    </dependency>
    <dependency>
      <groupId>io.micrometer</groupId>
      <artifactId>micrometer-registry-prometheus</artifactId>
    </dependency>
Init example of Vert.x metrics, starting a dedicated server (other options are possible):
      VertxOptions opts = new VertxOptions().setMetricsOptions(new MicrometerMetricsOptions()
          .setPrometheusOptions(new VertxPrometheusOptions()
              .setStartEmbeddedServer(true)
              .setEmbeddedServerOptions(new HttpServerOptions().setPort(9090))
              .setPublishQuantiles(true)
              .setEnabled(true))
          .setEnabled(true));
Full working example: https://github.com/jotak/bookinfo-runtimes/tree/master/reviews
The pod annotation for Kiali with the full list of dashboards is: kiali.io/dashboards: vertx-client,vertx-server,vertx-eventbus,vertx-pool,vertx-jvm
Create new dashboards
The built-in dashboards described above are just some of what you can have. It’s pretty easy to create new ones.
When installing Kiali, you define your own custom dashboards in the Kiali CR spec.custom_dashboards field. Here’s an example of what it looks like:
custom_dashboards:
- name: vertx-custom
  title: Vert.x Metrics
  runtime: Vert.x
  discoverOn: "vertx_http_server_connections"
  items:
  - chart:
      name: "Server response time"
      unit: "seconds"
      spans: 6
      metrics:
      - metricName: "vertx_http_server_responseTime_seconds"
        displayName: "Server response time"
      dataType: "histogram"
      aggregations:
      - label: "path"
        displayName: "Path"
      - label: "method"
        displayName: "Method"
  - chart:
      name: "Server active connections"
      unit: ""
      spans: 6
      metricName: "vertx_http_server_connections"
      dataType: "raw"
  - include: "micrometer-1.1-jvm"
  externalLinks:
  - name: "My custom Grafana dashboard"
    type: "grafana"
    variables:
      app: var-app
      namespace: var-namespace
      version: var-version
The name field corresponds to what you can set in the pod annotation kiali.io/dashboards.
The rest of the field definitions are:
-
runtime: optional, name of the related runtime. It will be displayed on the corresponding Workload Details page. If omitted no name is displayed.
-
title: dashboard title, displayed as a tab in Application or Workloads Details
-
discoverOn: metric name to match for auto-discovery. If omitted, the dashboard won’t be discovered automatically, but can still be used via pods annotation.
-
items: a list of items, that can be either chart, to define a new chart, or include to reference another dashboard
-
chart: new chart object
-
name: name of the chart
-
chartType: type of the chart, can be one of line (default), area, bar or scatter
-
unit: unit for Y-axis. Free-text field to provide any unit suffix. It can eventually be scaled on display. See specific section below.
-
unitScale: in case the unit needs to be scaled by some factor, set that factor here. For instance, if your data is in milliseconds, set
0.001as scale andsecondsas unit. -
spans: number of "spans" taken by the chart, from 1 to 12, using bootstrap convention
-
metrics: a list of metrics to display on this single chart:
-
metricName: the metric name in Prometheus
-
displayName: name to display on chart
-
-
dataType: type of data to be displayed in the chart. Can be one of raw, rate or histogram. Raw data will be queried without transformation. Rate data will be queried using promQL rate() function. And histogram with histogram_quantile() function.
-
min and max: domain for Y-values. When unset, charts implementations should usually automatically adapt the domain with the displayed data.
-
xAxis: type of the X-axis, can be one of time (default) or series. When set to series, only one datapoint per series will be displayed, and the chart type then defaults to bar.
-
aggregator: defines how the time-series are aggregated when several are returned for a given metric and label set. For example, if a Deployment creates a ReplicaSet of several Pods, you will have at least one time-series per Pod. Since Kiali shows the dashboards at the workload (ReplicaSet) level or at the application level, they will have to be aggregated. This field can be used to fix the aggregator, with values such as sum or avg (full list available in Prometheus documentation). However, if omitted the aggregator will default to sum and can be changed from the dashboard UI.
-
aggregations: list of labels eligible for aggregations / groupings (they will be displayed in Kiali through a dropdown list)
-
label: Prometheus label name
-
displayName: name to display in Kiali
-
singleSelection: boolean flag to switch between single-selection and multi-selection modes on the values of this label. Defaults to false.
-
-
groupLabels: a list of Prometheus labels to be used for grouping. Similar to aggregations, except this grouping will be always turned on.
-
sortLabel: Prometheus label to be used for the metrics display order.
-
sortLabelParseAs: set to int if sortLabel needs to be parsed and compared as an integer instead of string.
-
-
include: to include another dashboard, or a specific chart from another dashboard. Typically used to compose with generic dashboards such as the ones about MicroProfile Metrics or Micrometer-based JVM metrics. To reference a full dashboard, set the name of that dashboard. To reference a specific chart of another dashboard, set the name of the dashboard followed by
$and the name of the chart (ex:include: "microprofile-1.1$Thread count").
-
-
externalLinks: a list of related external links (e.g. to Grafana dashboards)
-
name: name of the related dashboard in the external system (e.g. name of a Grafana dashboard)
-
type: link type, currently only grafana is allowed
-
variables: a set of variables that can be injected in the URL. For instance, with something like namespace: var-namespace and app: var-app, an URL to a Grafana dashboard that manages namespace and app variables would look like: http://grafana-server:3000/d/xyz/my-grafana-dashboard?var-namespace=some-namespace&var-app=some-app. The available variables in this context are namespace, app and version.
-
Label clash: you should try to avoid labels clashes within a dashboard. In Kiali, labels for grouping are aggregated in the top toolbar, so if the same label refers to different things depending on the metric, you wouldn’t be able to distinguish them in the UI. For that reason, ideally, labels should not have too generic names in Prometheus. For instance labels named "id" for both memory spaces and buffer pools would better be named "space_id" and "pool_id". If you have control on label names, it’s an important aspect to take into consideration. Else, it is up to you to organize dashboards with that in mind, eventually splitting them into smaller ones to resolve clashes.
Modifying Built-in Dashboards: If you want to modify or remove a built-in dashboard, you can set its new definition in the Kiali CR’s spec.custom_dashboards. Simply define a custom dashboard with the same name as the built-in dashboard. To remove a built-in dashboard so Kiali doesn’t use it, simply define a custom dashboard by defining only its name with no other data associated with it (e.g. in spec.custom_dashboards you add a list item that has - name: <name of built-in dashboard to remove>.
Create new dashboards per namespace or workload
The custom dashboards defined in the Kiali CR are available for all workloads in all namespaces.
Additionally, new custom dashboards can be created for a given namespace or workload, using the dashboards.kiali.io/templates annotation.
This is an example where a "Custom Envoy" dashboard will be available for all applications and workloads for the default namespace:
apiVersion: v1
kind: Namespace
metadata:
  name: default
  annotations:
    dashboards.kiali.io/templates: |
      - name: custom_envoy
        title: Custom Envoy
        discoverOn: "envoy_server_uptime"
        items:
          - chart:
              name: "Pods uptime"
              spans: 12
              metricName: "envoy_server_uptime"
              dataType: "raw"
This other example will create an additional "Active Listeners" dashboard only on details-v1 workload:
apiVersion: apps/v1
kind: Deployment
metadata:
  name: details-v1
  labels:
    app: details
    version: v1
spec:
  replicas: 1
  selector:
    matchLabels:
      app: details
      version: v1
  template:
    metadata:
      labels:
        app: details
        version: v1
      annotations:
        dashboards.kiali.io/templates: |
          - name: envoy_listeners
            title: Active Listeners
            discoverOn: "envoy_listener_manager_total_listeners_active"
            items:
              - chart:
                  name: "Total Listeners"
                  spans: 12
                  metricName: "envoy_listener_manager_total_listeners_active"
                  dataType: "raw"
    spec:
      serviceAccountName: bookinfo-details
      containers:
      - name: details
        image: docker.io/istio/examples-bookinfo-details-v1:1.16.2
        imagePullPolicy: IfNotPresent
        ports:
        - containerPort: 9080
        securityContext:
          runAsUser: 1000
Units
Some units are recognized in Kiali and scaled appropriately when displayed on charts:
-
unit: "seconds"can be scaled down toms,µs, etc. -
unit: "bytes-si"andunit: "bitrate-si"can be scaled up tokB,MB(etc.) using SI / metric system. The aliasesunit: "bytes"andunit: "bitrate"can be used instead. -
unit: "bytes-iec"andunit: "bitrate-iec"can be scaled up toKiB,MiB(etc.) using IEC standard / IEEE 1541-2002 (scale by powers of 2).
Other units will fall into the default case and be scaled using SI standard. For instance, unit: "m" for meter can be scaled up to km.

