Architecture
Kiali is composed of two components: a back-end application running in the container application platform, and a user-facing front-end application. Kiali depends on external services and components provided by the container application platform and Istio.
The following diagram illustrates the components involved in Kiali and its interactions:
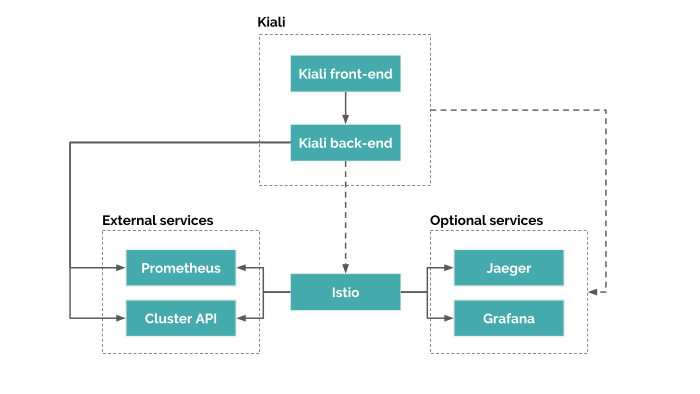
Kiali back-end
The back-end is the application that runs in the container application platform. It’s written in Go. The code can be found at kiali/kiali GitHub repository.
This is the component that communicates with Istio parts, retrieves and processes data, and exposes this data to the front-end.
The back-end doesn’t need storage. The back-end configuration is managed via the Kiali CR when Kiali is installed via the Kiali operator, or via a configmap when installed via Helm.
Kiali front-end
The front-end is a single page web application, built using Patternfly, React, Typescript and Redux. The code can be found at kiali/kiali-ui GitHub repository.
In a standard deployment, the back-end serves the front-end. Then, the front-end queries the Kiali back-end in order to get data and present it to the user.
There are limited options for personalization, the front-end is mainly stateless. Some data may be persisted, such as session credentials, but this data is stored in the browser and won’t be available in other browsers nor other devices.
Istio Service Mesh
Kiali is a management console for Istio, and as such, Istio is a requirement. It provides and controls the service mesh. Kiali and Istio are installed separately.
Kiali needs to retrieve Istio data and configurations, which are exposed through Prometheus and the cluster API. This is the reason the diagram shows a dashed line: to denote an indirect dependency.
Prometheus
Prometheus is an Istio dependency. When Istio telemetry is enabled, metrics data is stored in Prometheus. Kiali uses the data stored in Prometheus to figure out the mesh topology, show metrics, calculate health, show possible problems, etc.
Kiali communicates directly with Prometheus and assumes the metrics used by Istio Telemetery. It’s a hard dependency for Kiali, and many Kiali features will not work without it.
Currently, Kiali relies on Istio’s default metrics set. Make sure that these default metrics are always in place. Some metric customization is possible as long as the Kiali requirements are still met. For the current list of required metrics see this FAQ entry.
Cluster API
Kiali uses the API of the container application platform (cluster API) in order to fetch and resolve service mesh configurations.
Container application platforms where Kiali is known to work are OKD and Kubernetes. Kiali shoud also work on the derivatives of these platforms. If you want to learn the cluster API, check the OKD REST API reference and the Kubernetes API reference.
Kiali queries the cluster API to retrieve, for example, definitions for namespaces, services, deployments, pods, and other entities. Kiali also makes queries to resolve relationships between the different cluster entities.
The cluster API is also queried to retrieve Istio configurations like virtual services, destination rules, route rules, gateways, and quotas.
Jaeger
Jaeger is optional. When available, Kiali will be able to direct the user to Jaeger’s tracing data. If you need this feature, make sure Kiali is properly configured for Jaeger integration.
Tracing data will be available only if Istio’s distributed tracing is enabled.
Grafana
Grafana is optional. When available, the metrics pages of Kiali will show a link to direct the user to the same metric in Grafana. If you need this feature, make sure Kiali is properly configured for Grafana integration.
Kiali has basic metric capabilities. It can show the default Istio metrics for workloads, apps and services. It allows to apply some groupings to the provided metrics and fetch metrics for different time ranges. However, Kiali doesn’t allow to customize the views nor customize the Prometheus queries. If you need these capabilities, you’ll want to install Grafana. Follow the Istio documentation to install Grafana if you need it.