Distributed Tracing
Kiali shows tracing of your applications. We currently support Jaeger version 1.9 and newer.
1. Configuration
1.1. In cluster URL
In order to fetch data from Jaeger, Kiali needs to get an URL that can be resolved from inside the cluster, typically using Kubernetes DNS. This is the in_cluster_url configuration. For instance, for a Jaeger service named tracing within istio-system namespace, Kiali config would be:
  external_services:
    tracing:
      in_cluster_url: 'http://tracing.istio-system/jaeger'
If you use the Kiali operator (recommended), this config can be set in the Kiali CR. But in most cases, the Kiali operator will set a valid default in_cluster_url so you wouldn’t have to change anything. If you don’t use the Kiali operator, this config can be set in Kiali config map.
1.2. External URL
Configuring an external URL for Jaeger will enable links from Kiali to Jaeger UI. This URL needs to be accessible from the browser (it’s used for links generation). Example:
  external_services:
    tracing:
      in_cluster_url: 'http://tracing.istio-system/jaeger'
      url: 'http://my-jaeger-host/jaeger'
Once this URL is set, Kiali will show an additional item to the main menu:
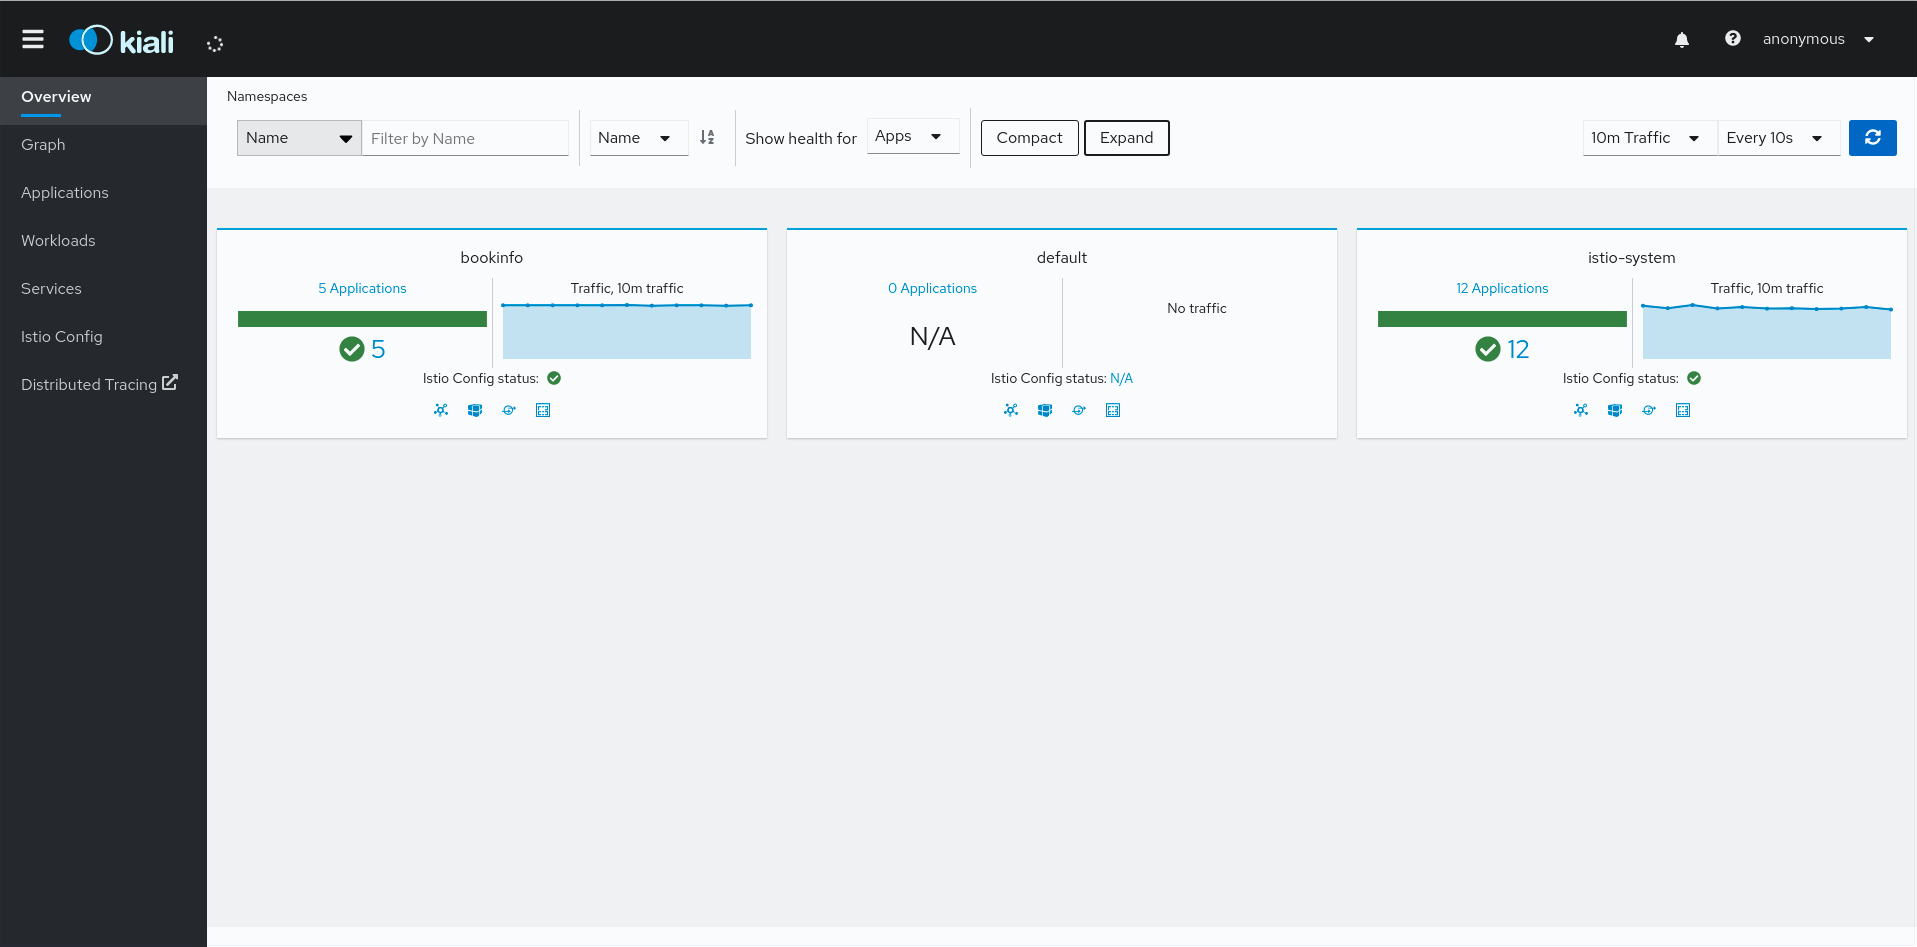
You may have url configured and not in_cluster_url, for instance, if Jaeger is not accessible from Kiali pod. In this situation, Kiali will not show its own traces chart but will display external links to the Jaeger UI instead.
1.3. Other configuration
For advanced configuration on Jaeger integration, please refer to the Kiali CR 'external_services.tracing' section. It is relevant for config map as well, if you don’t use the Kiali operator.
2. Tracing View
The tracing view is accessible if the in-cluster URL is correctly configured. Each service page will show the Traces tab where a scatter plot is displayed with its related traces.
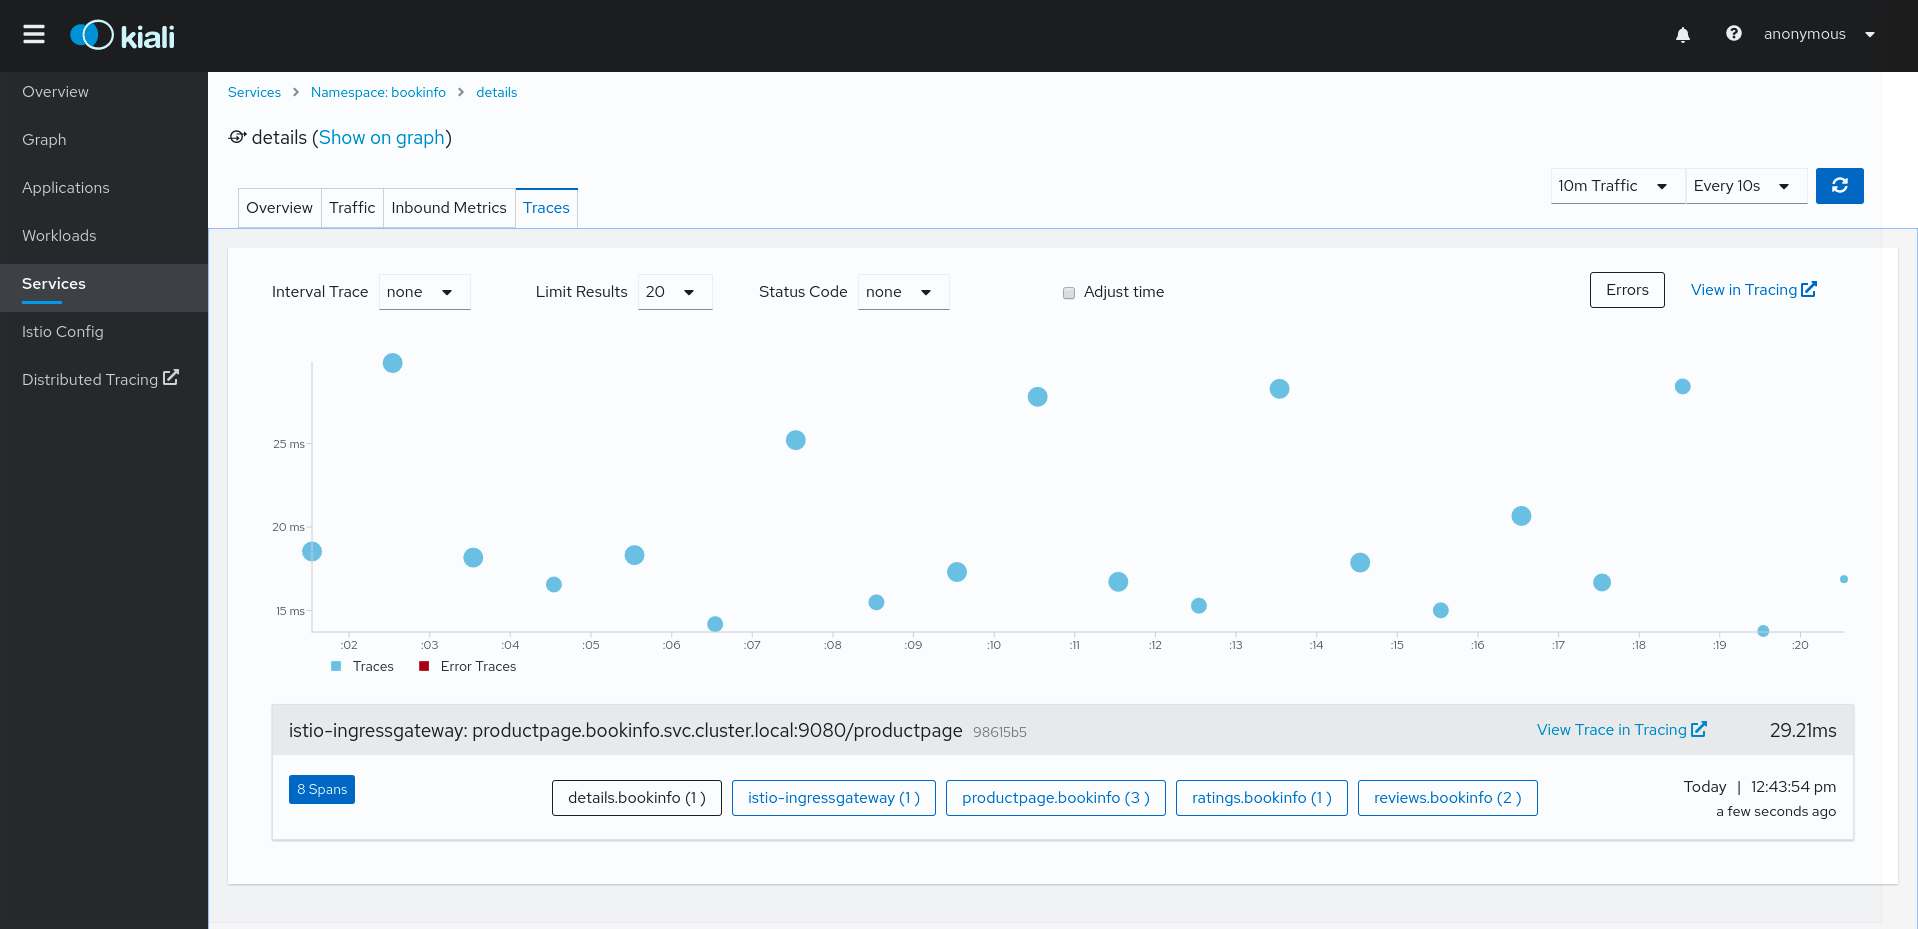
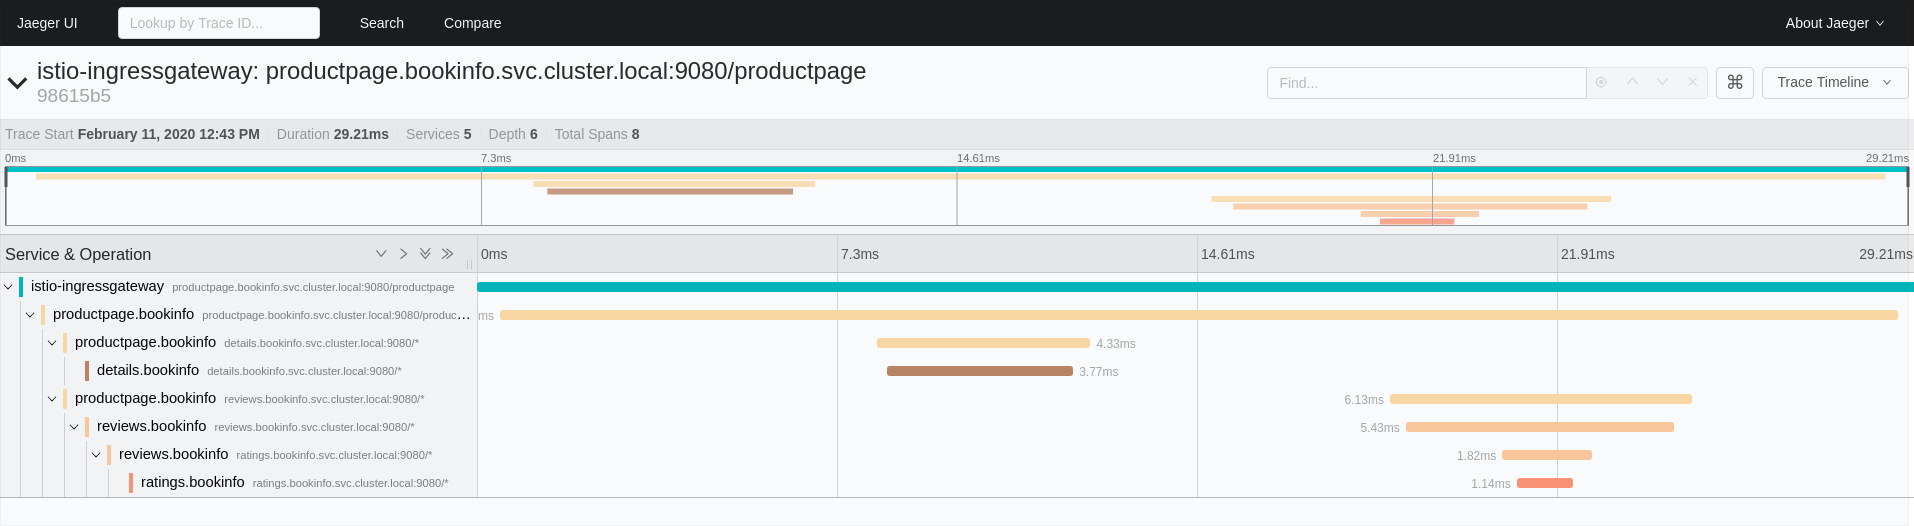
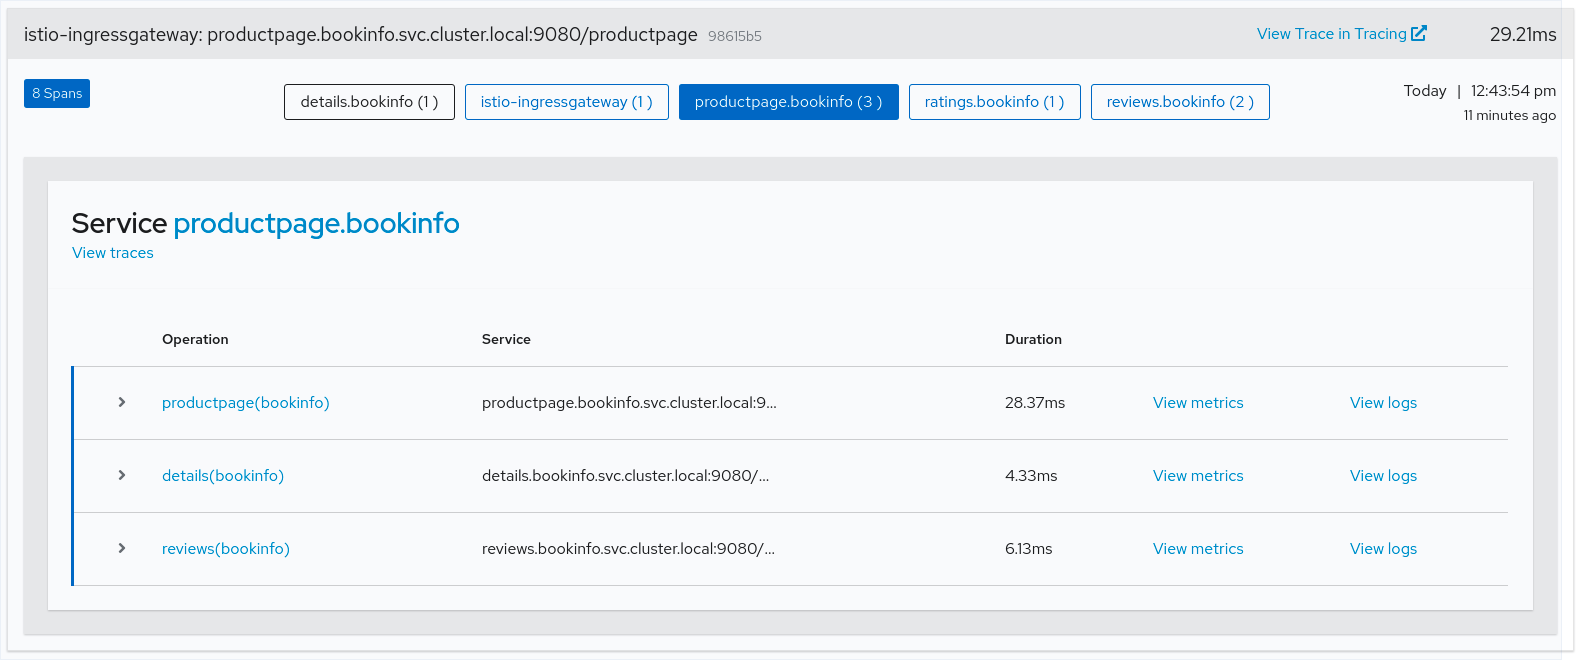
Kiali allows interactions with Jaeger UI via external links: For example, "View Trace in Tracing" goes to the Jaeger UI trace view.
3. Tracing Toolbar
The tracing toolbar offers some control over the data to fetch, to facilitate the user experience. In the tracing view, as shown in the image below, it’s possible to select the traces interval, results limit, status code, errors, adjust time (expand results on time), last Xm traffic (Traces from last minutes) and refresh interval.

3.1. Tracing Results
After selecting a trace, Kiali shows the information related to that trace like number of spans, spans grouped by operation name, duration, date…
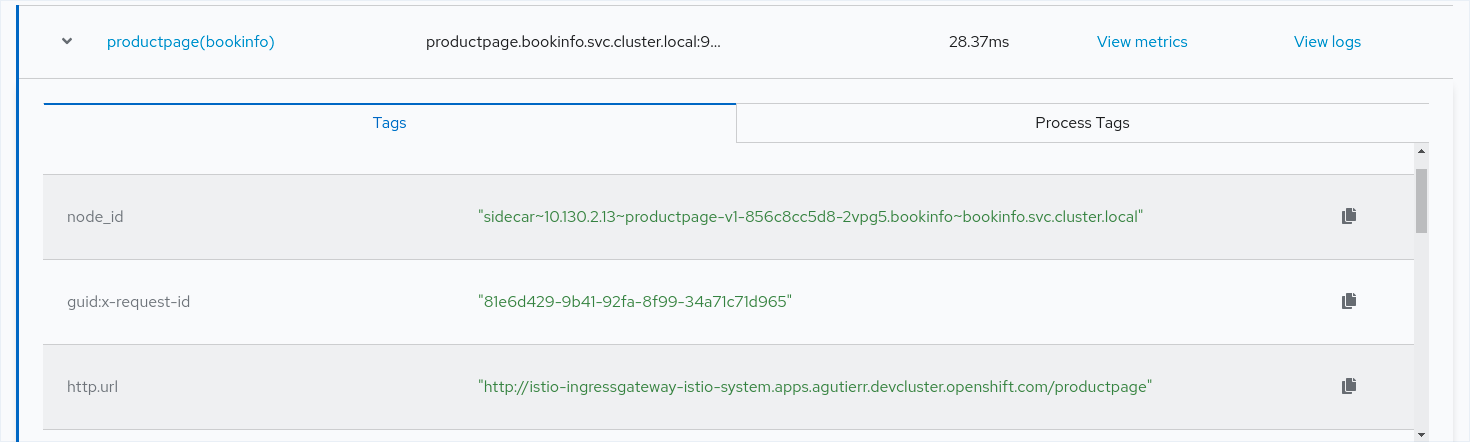
In each span, tags and processes are displayed.