Features
Kiali helps you define, validate, and observe the connections and microservices of your Istio service mesh.
Kiali works with Istio in Kubernetes distributions. It visualizes the service mesh topology and provides visibility into features like request routing, circuit breakers, request rates, latency and more. Kiali offers insights about the mesh components at different levels, from abstract Applications to Services and Workloads.
Kiali also helps to manage the Service Mesh providing Wizards to apply common traffic patterns and automatically generate Istio configuration.
Observability Features
The following observability features help you ensure your mesh is healthy or to quickly identify problem areas in operation. It combines topology, telemetry, traces, logs, events and definitions in a holistic view of your system.
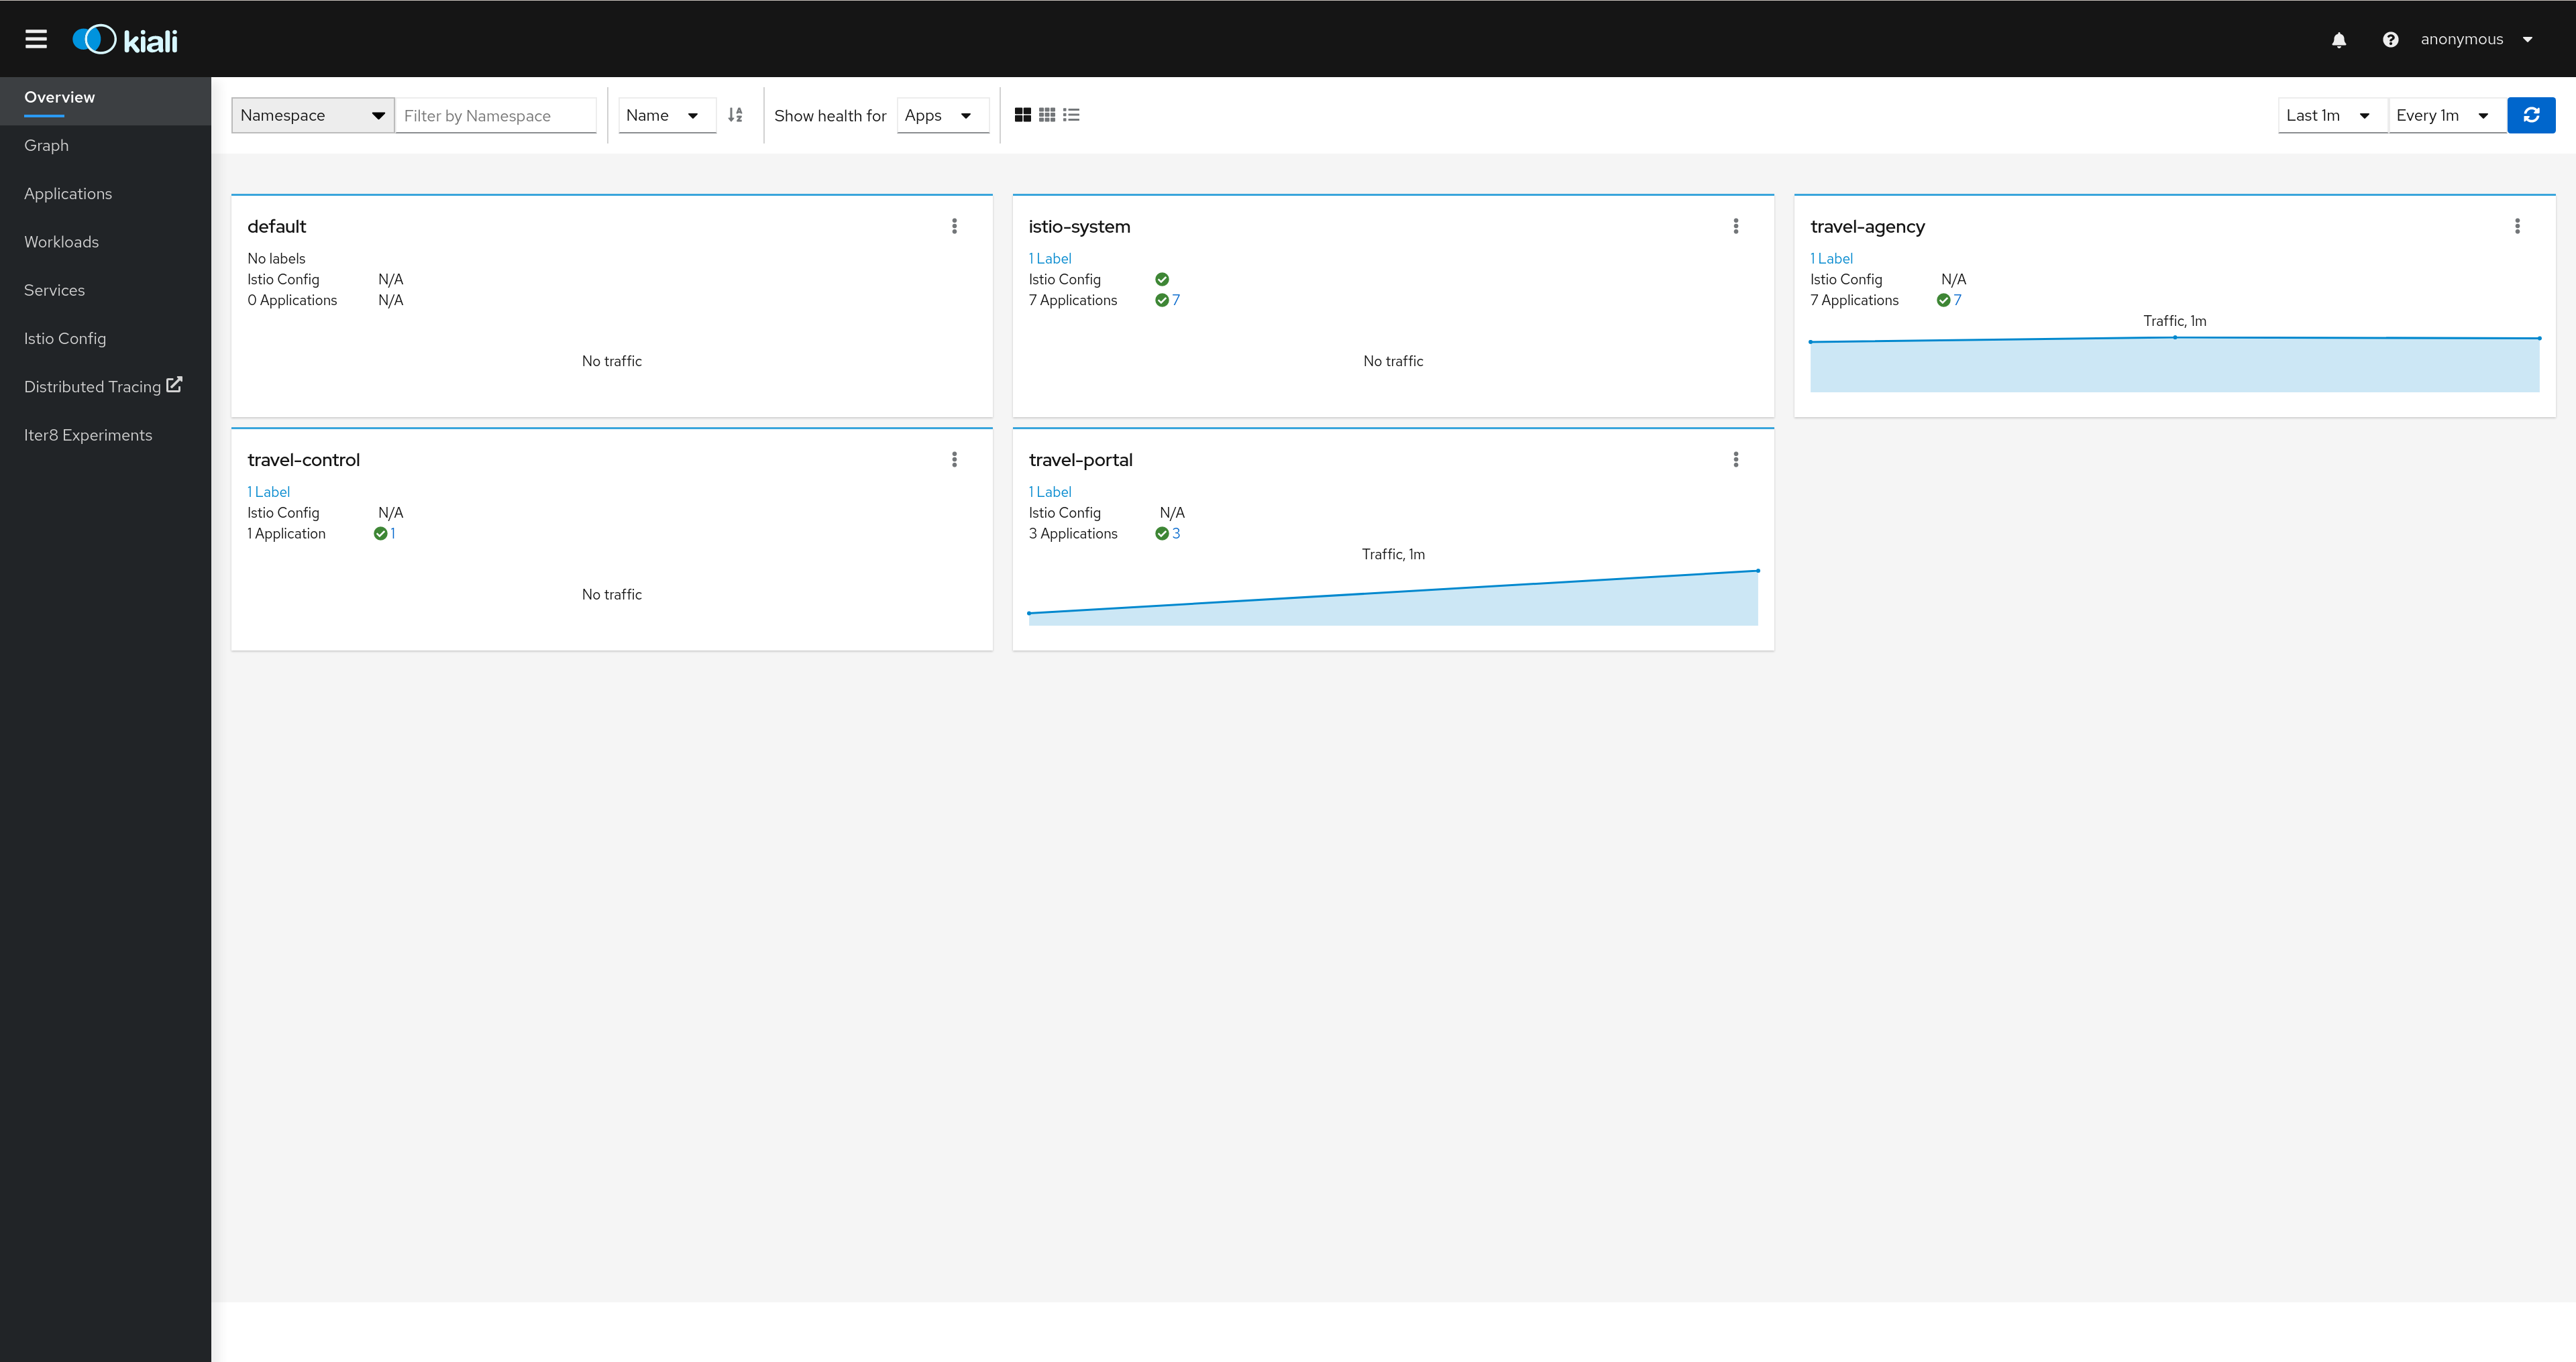
Overview
Kiali provides a summary page of the Service Mesh namespaces and the status of their Applications, Workloads and Services.
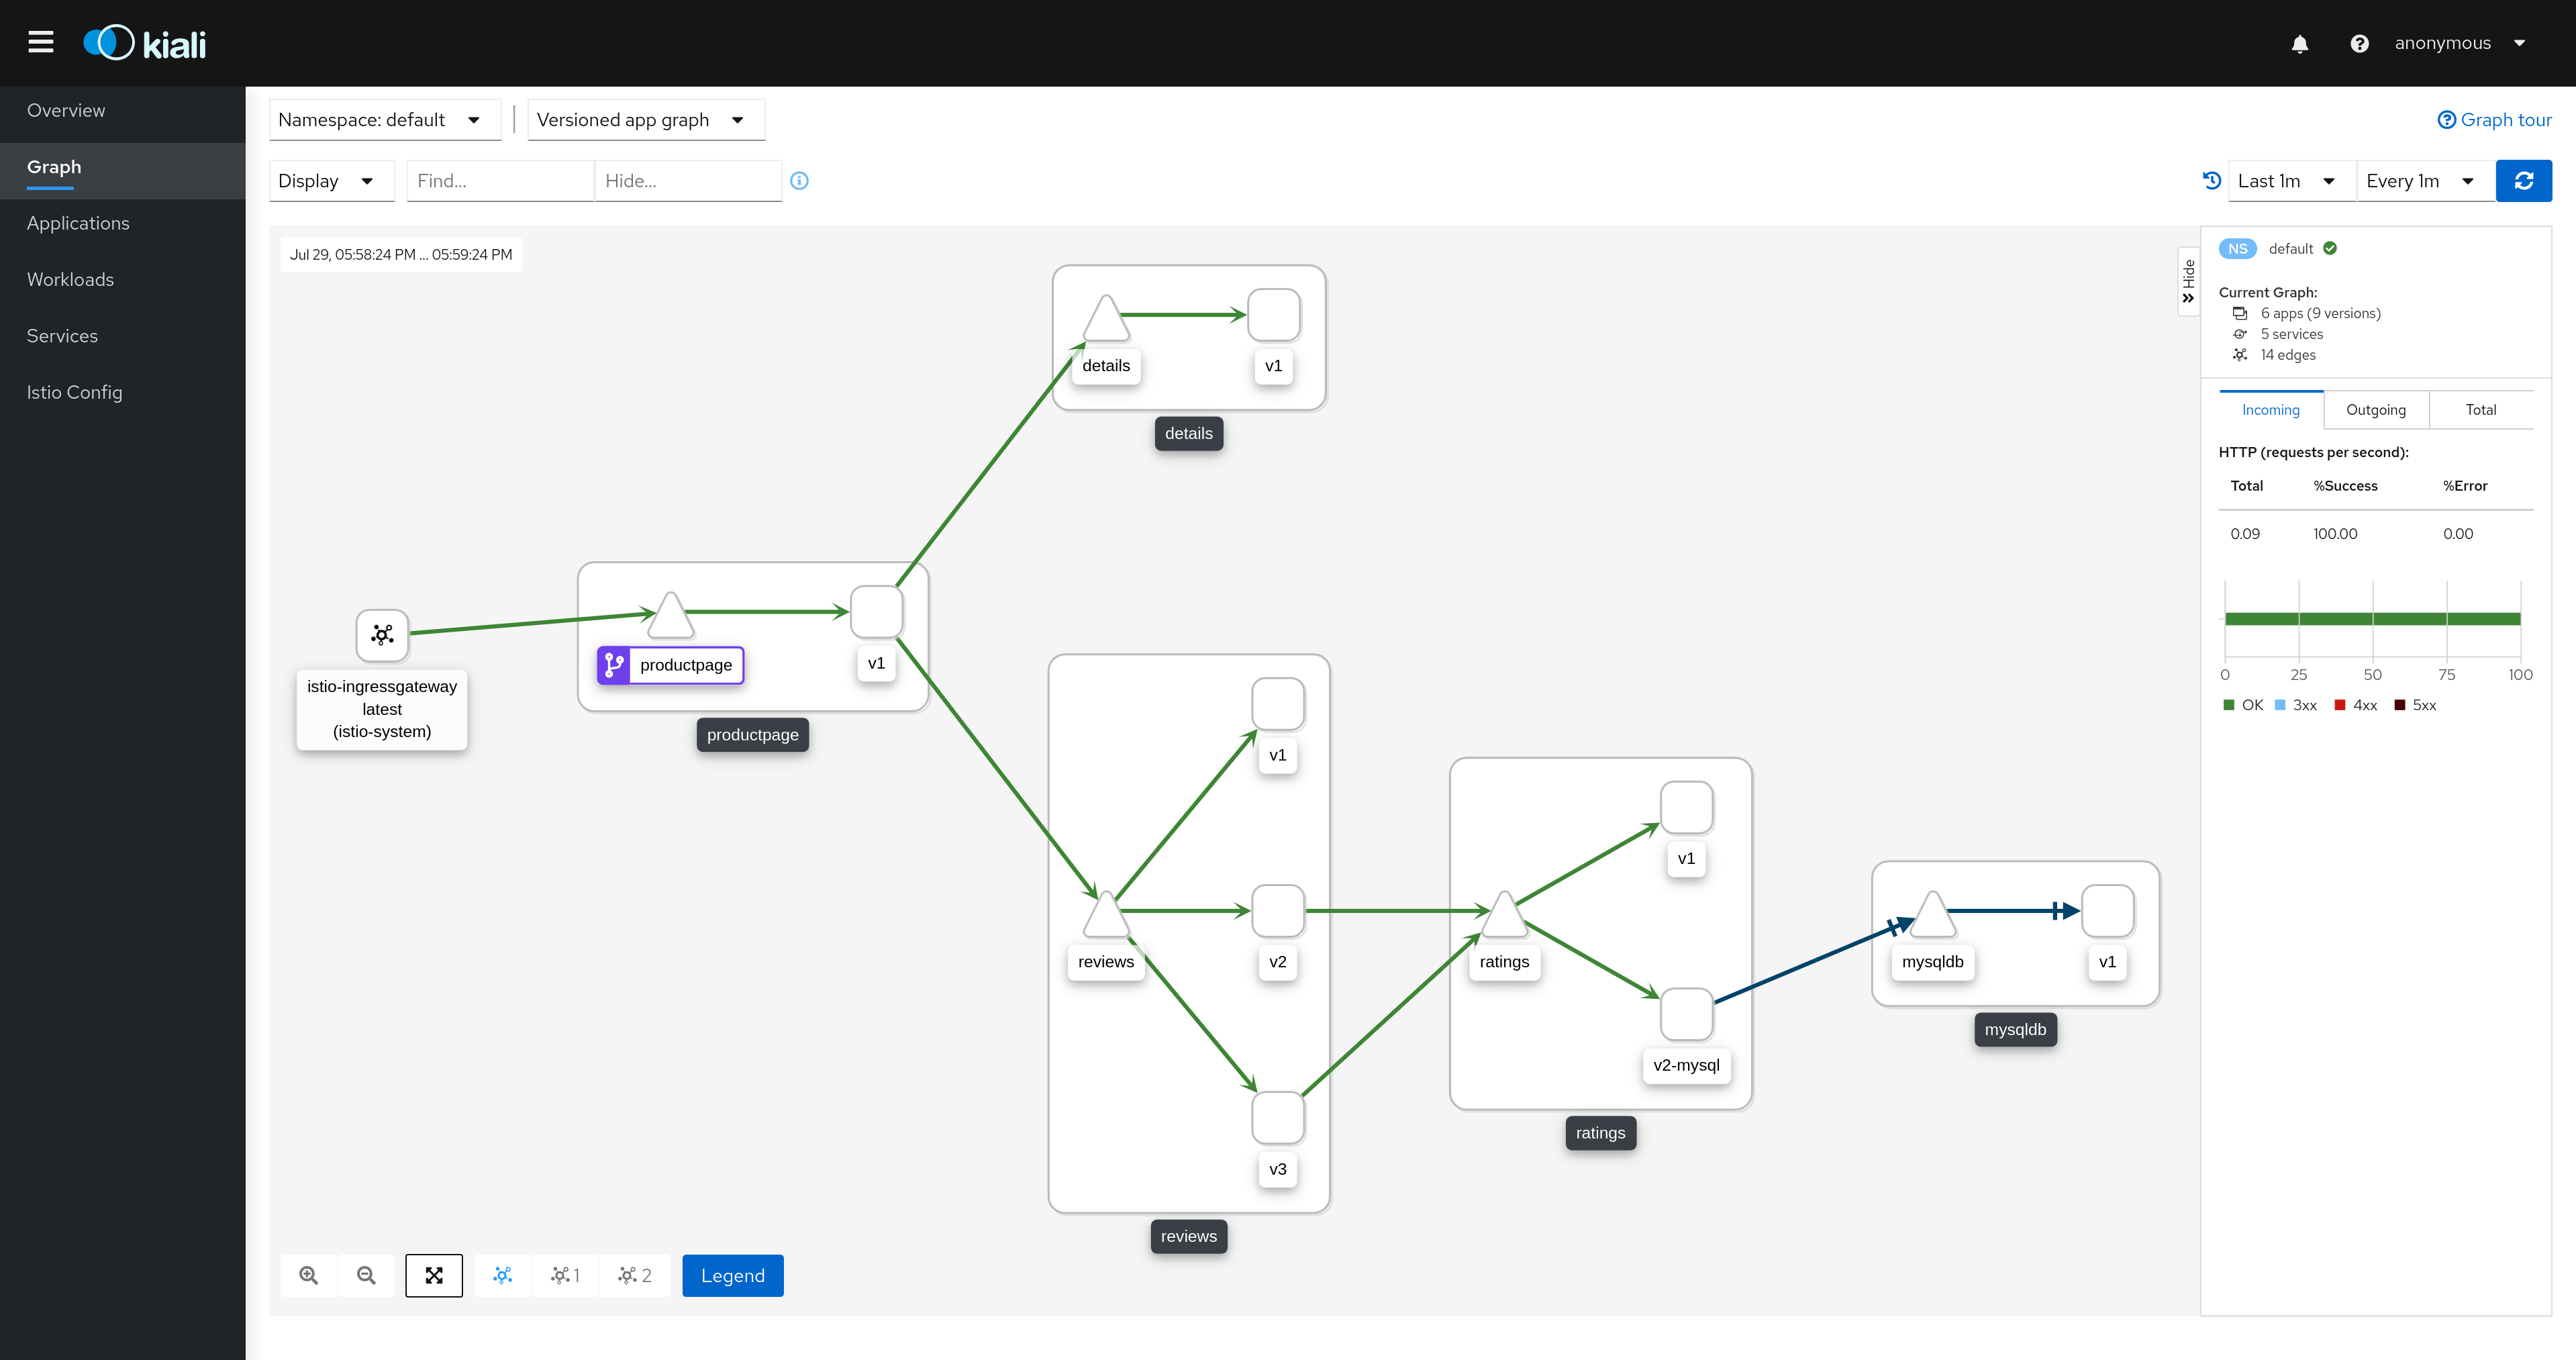
Graph
The graph provides a powerful way to visualize the topology of your service mesh. It shows you which services communicate with each other and the traffic rates and latencies between them, which helps you visually identify problem areas and quickly pinpoint issues. Kiali provides graphs that show a high-level view of service interactions, a low level view of workloads, or a logical view of applications.
The graph also shows which services are configured with virtual services and circuit breakers. It identifies security issues by identifying traffic not configured as expected. You can observe the traffic flow between components by watching the animation or viewing the metrics.
You can configure the graph to show the namespaces and data that are important to you, and display it in the way that best meets your needs.
Graph: Health
Colors in the graph represent the health of your service mesh. A node colored red or orange might need attention. The color of an edge between components represents the health of the requests between those components. The node shape indicates the type of component such as services, workloads, or apps.
The health of nodes and edges is refreshed automatically based on the user’s preference. The graph can also be paused to examine a particular state, or replayed to re-examine a particular time period.

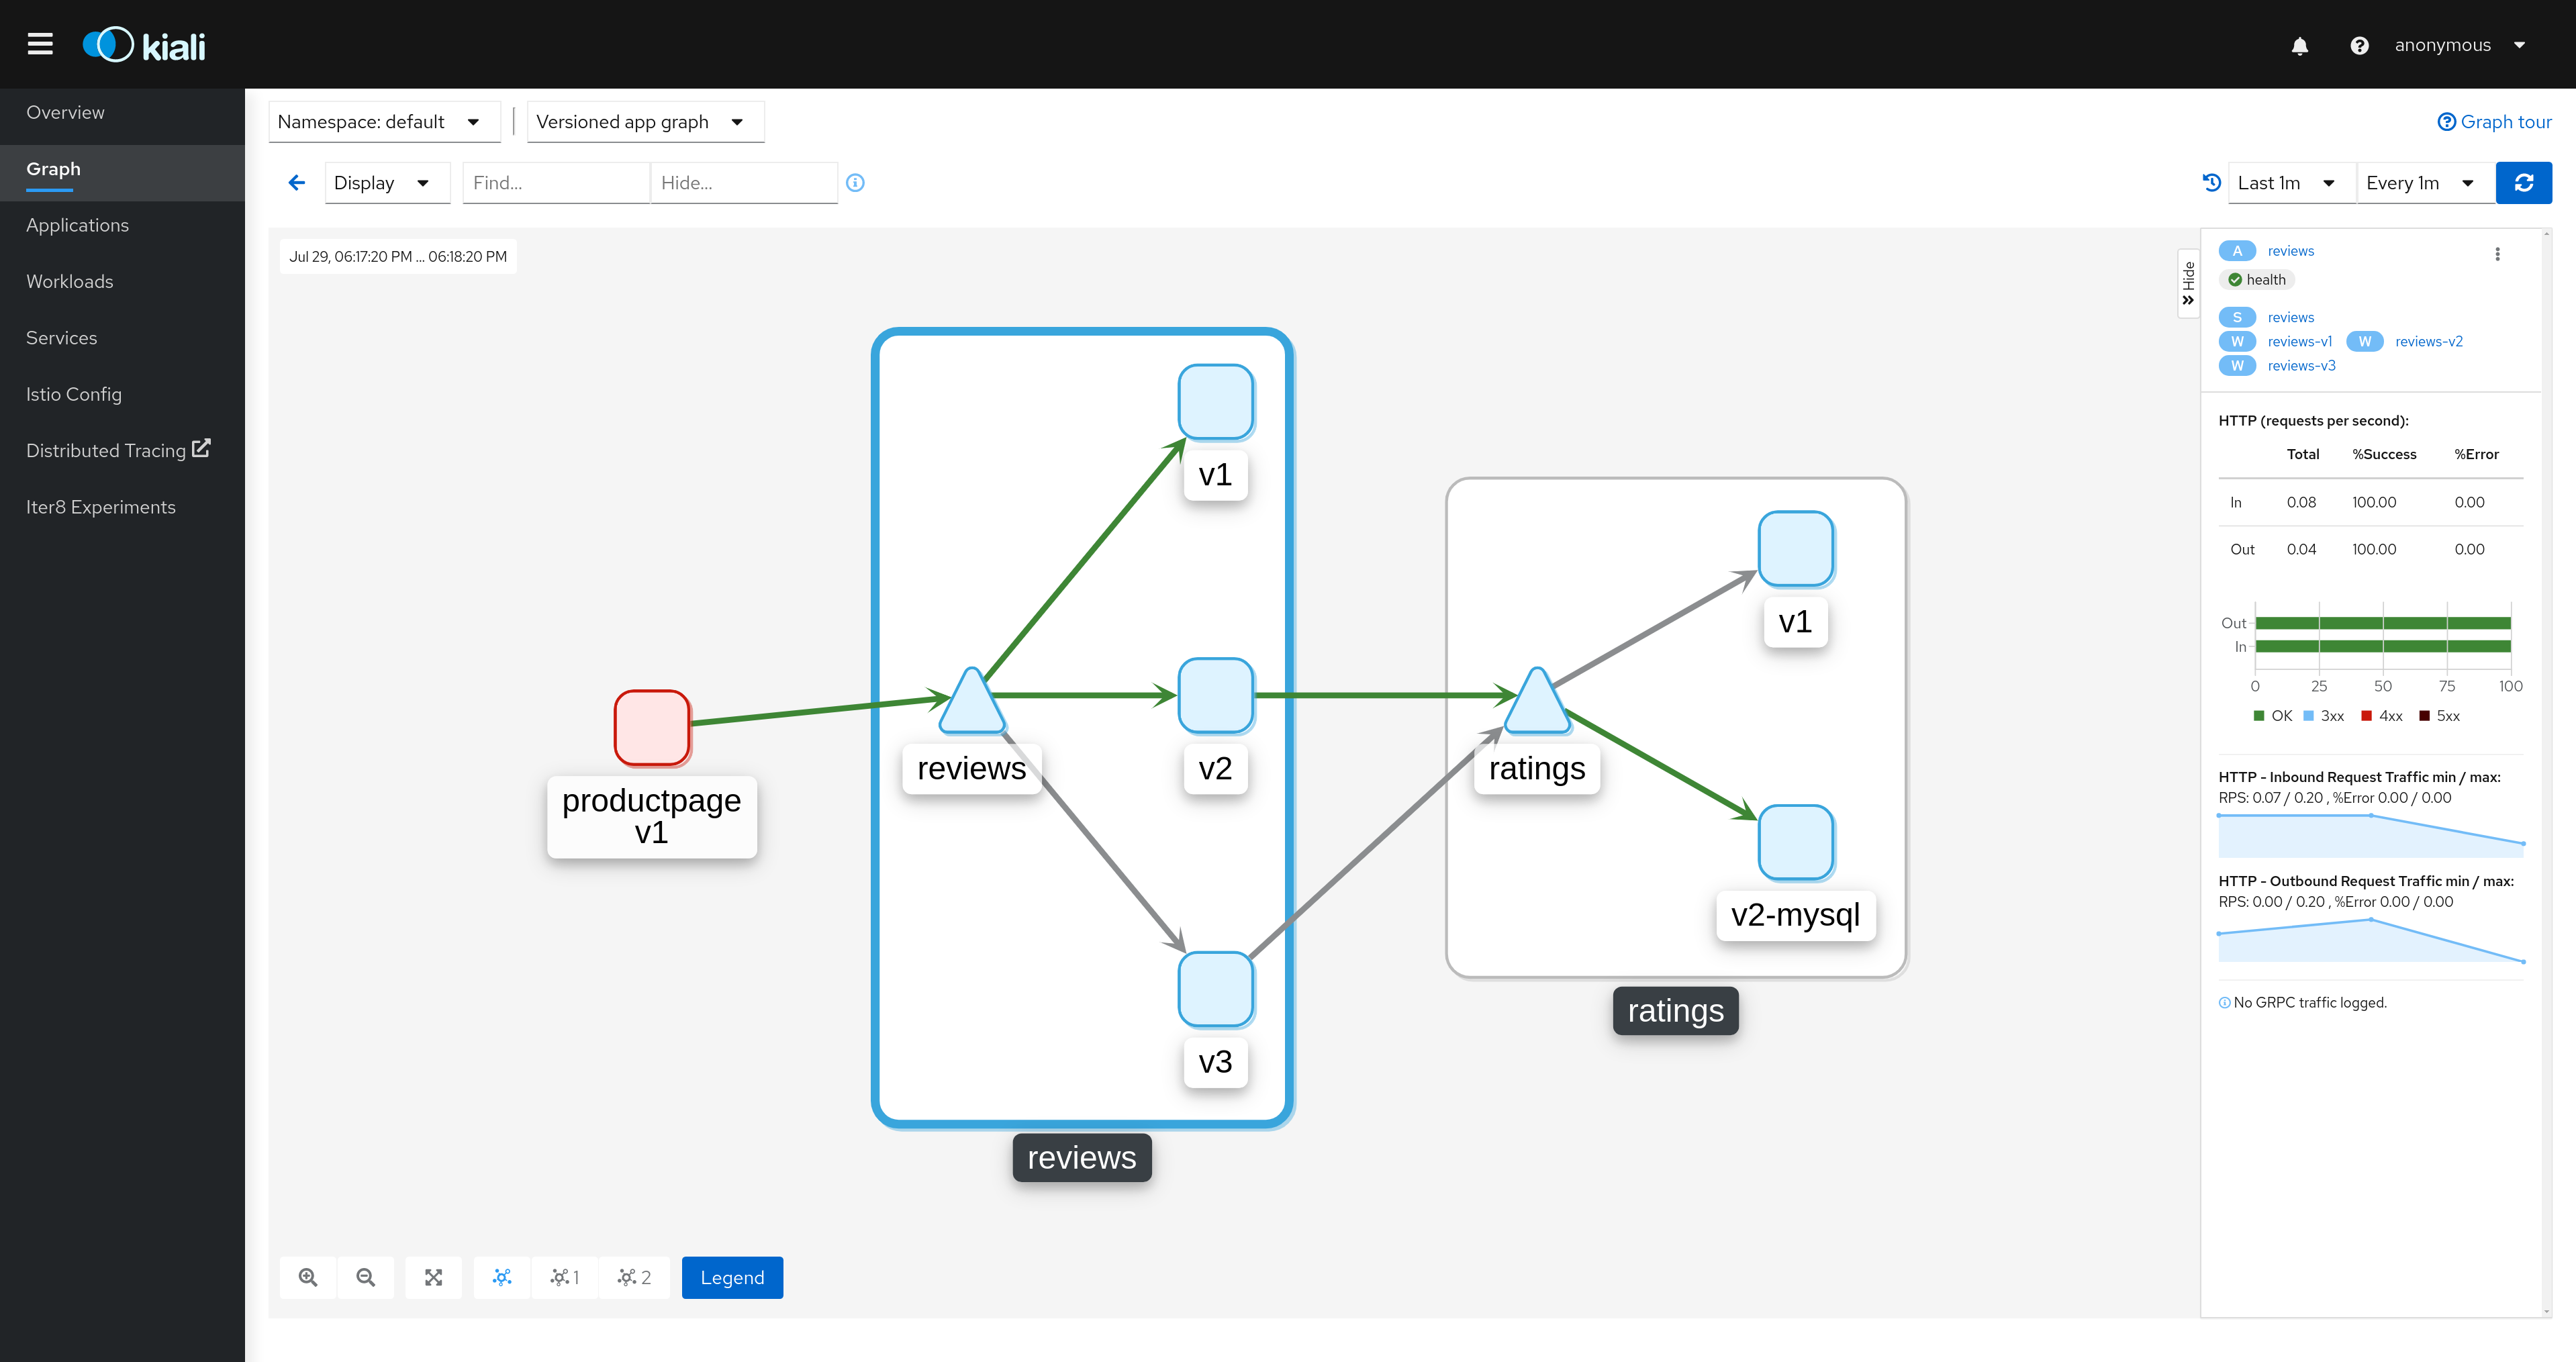
Graph: Node Detail
You can drill down into one selected component, whether it’s a service, a workload, or an application. Kiali offers detail graphs for any node you choose.
Double click on a graph node and you can see a detailed view centered on that component. It shows you only the incoming requests being served and the outgoing requests being made - all from the point-of-view of that component’s telemetry.
You can jump back to the main graph and continue where you left off.
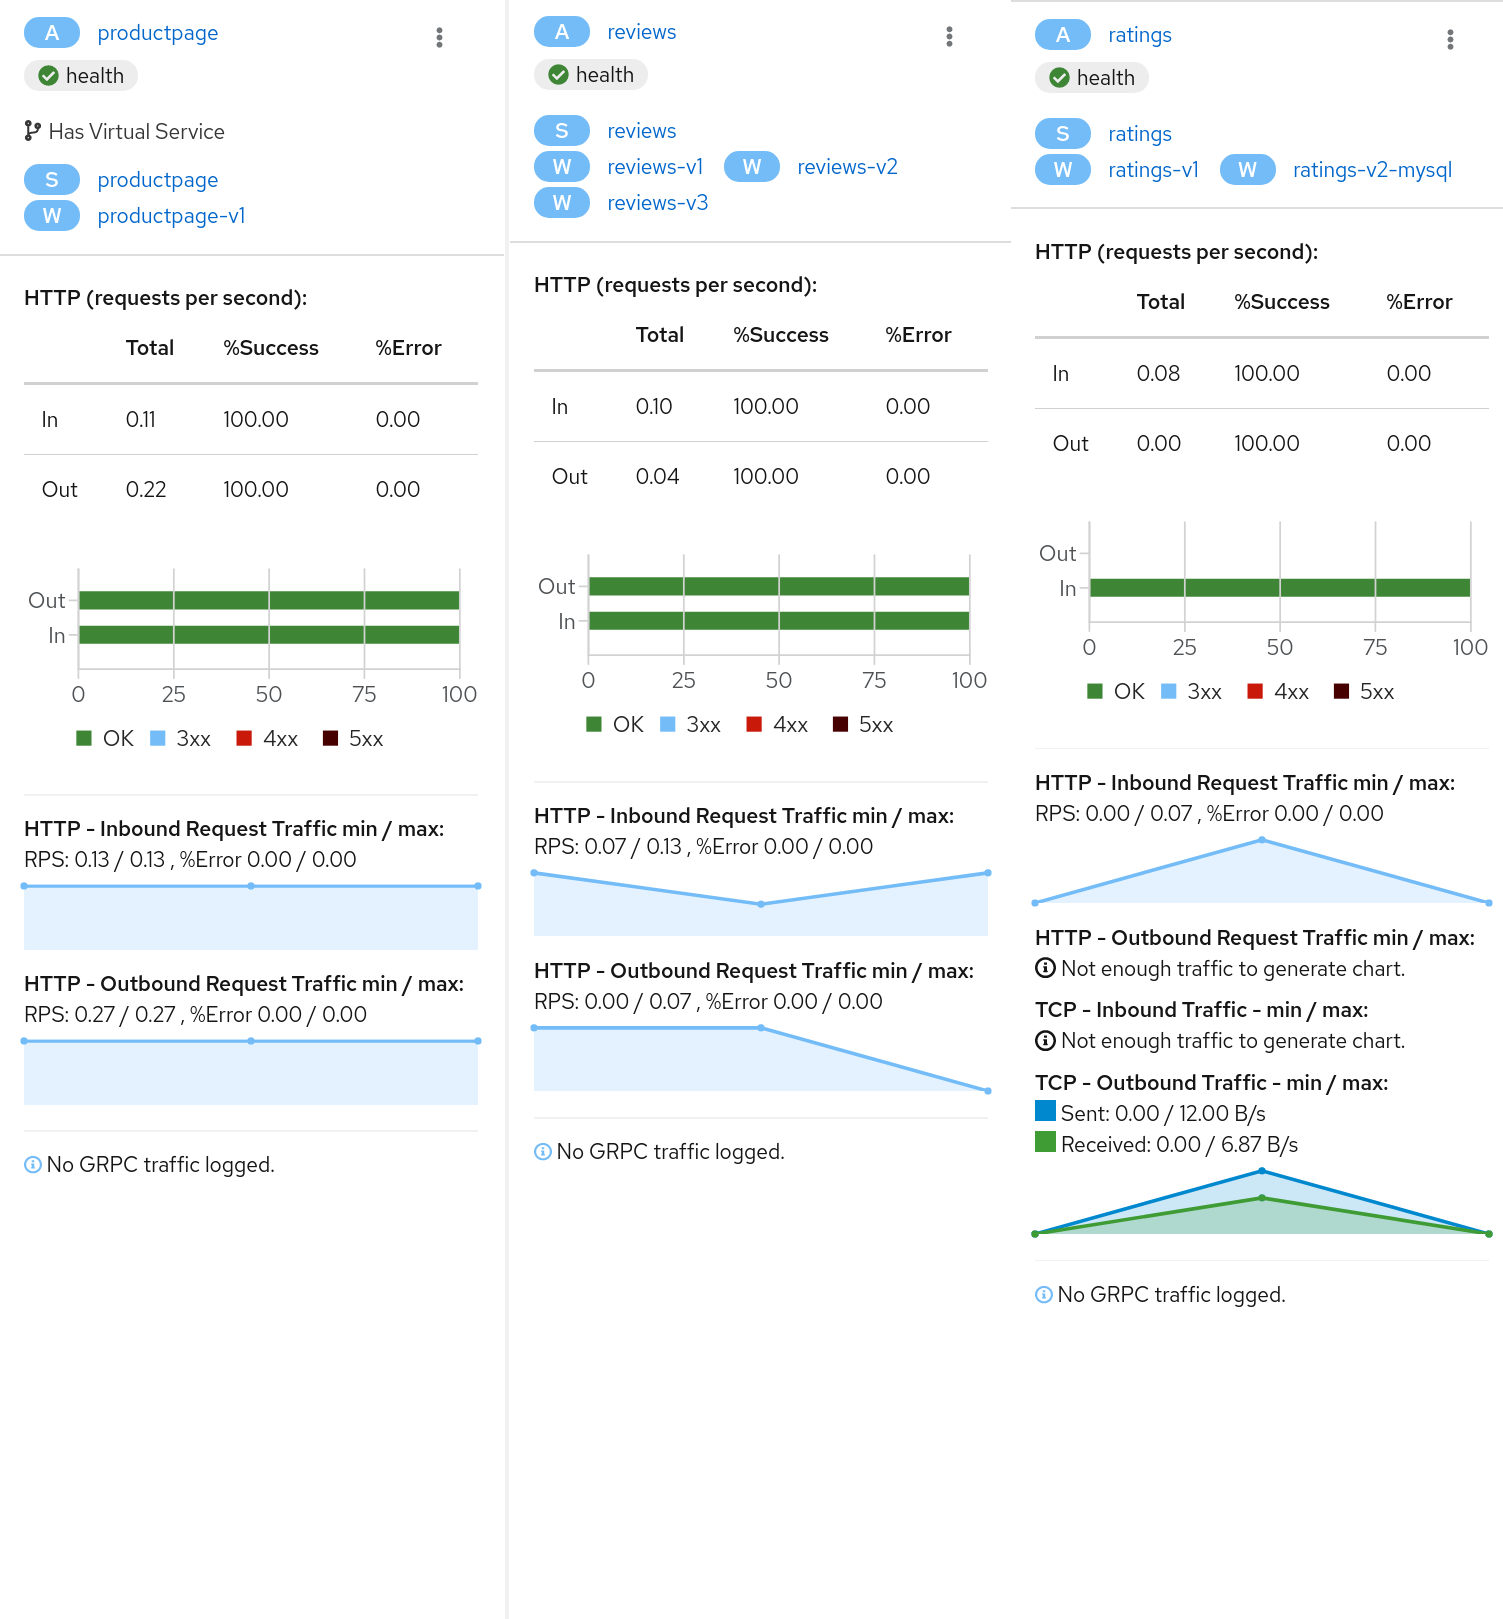
Graph: Side-Panel
Want to get a quick summary of anything in the graph? Select any node with a single-click and the side panel provides a brief summary for that component. This includes:
-
Charts showing traffic and response times
-
Health details
-
Links to fully-detailed pages
-
Response Code breakdowns.
Or, click the graph background and the side panel to view an overall summary for the entire graph.
Graph: Traffic Animation
Kiali offers several display options for the graph, including traffic animation.
For HTTP traffic, circles represent successful requests while red diamonds represent errors. The more dense the circles and diamonds the higher the request rate. The faster the animation the faster the response times.
TCP traffic is represented by offset circles where the speed of the circles indicates the traffic speed.
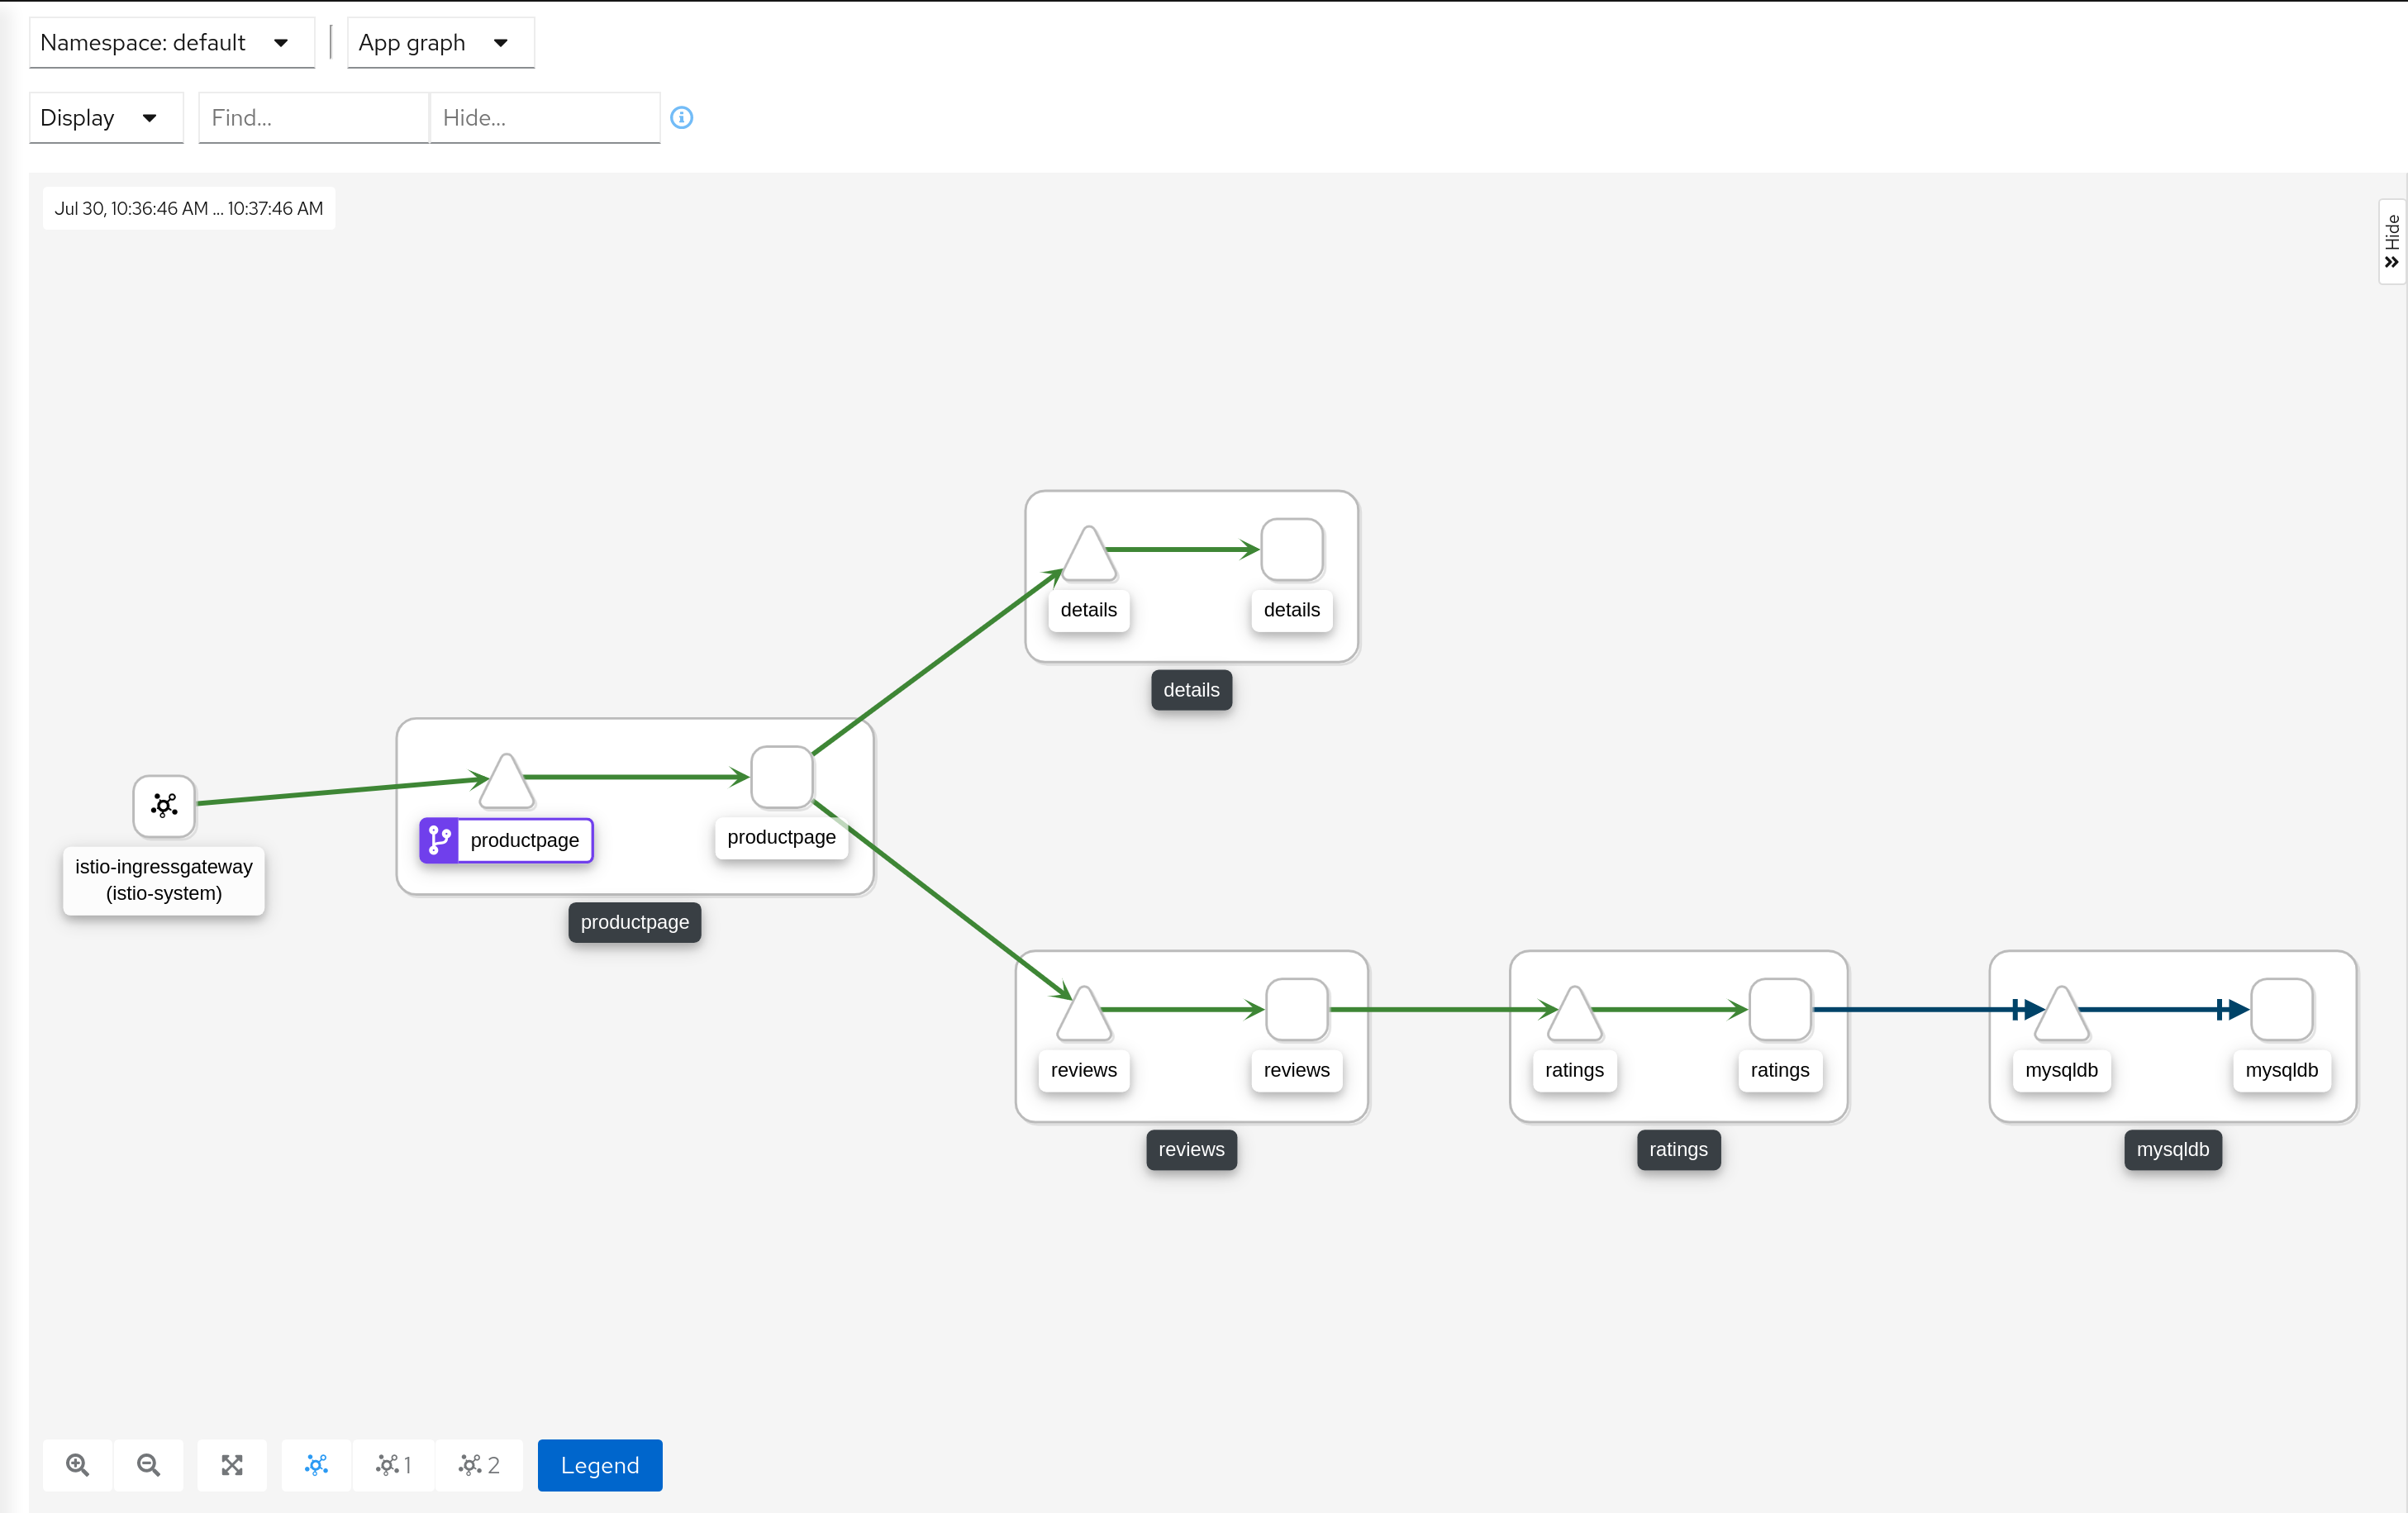
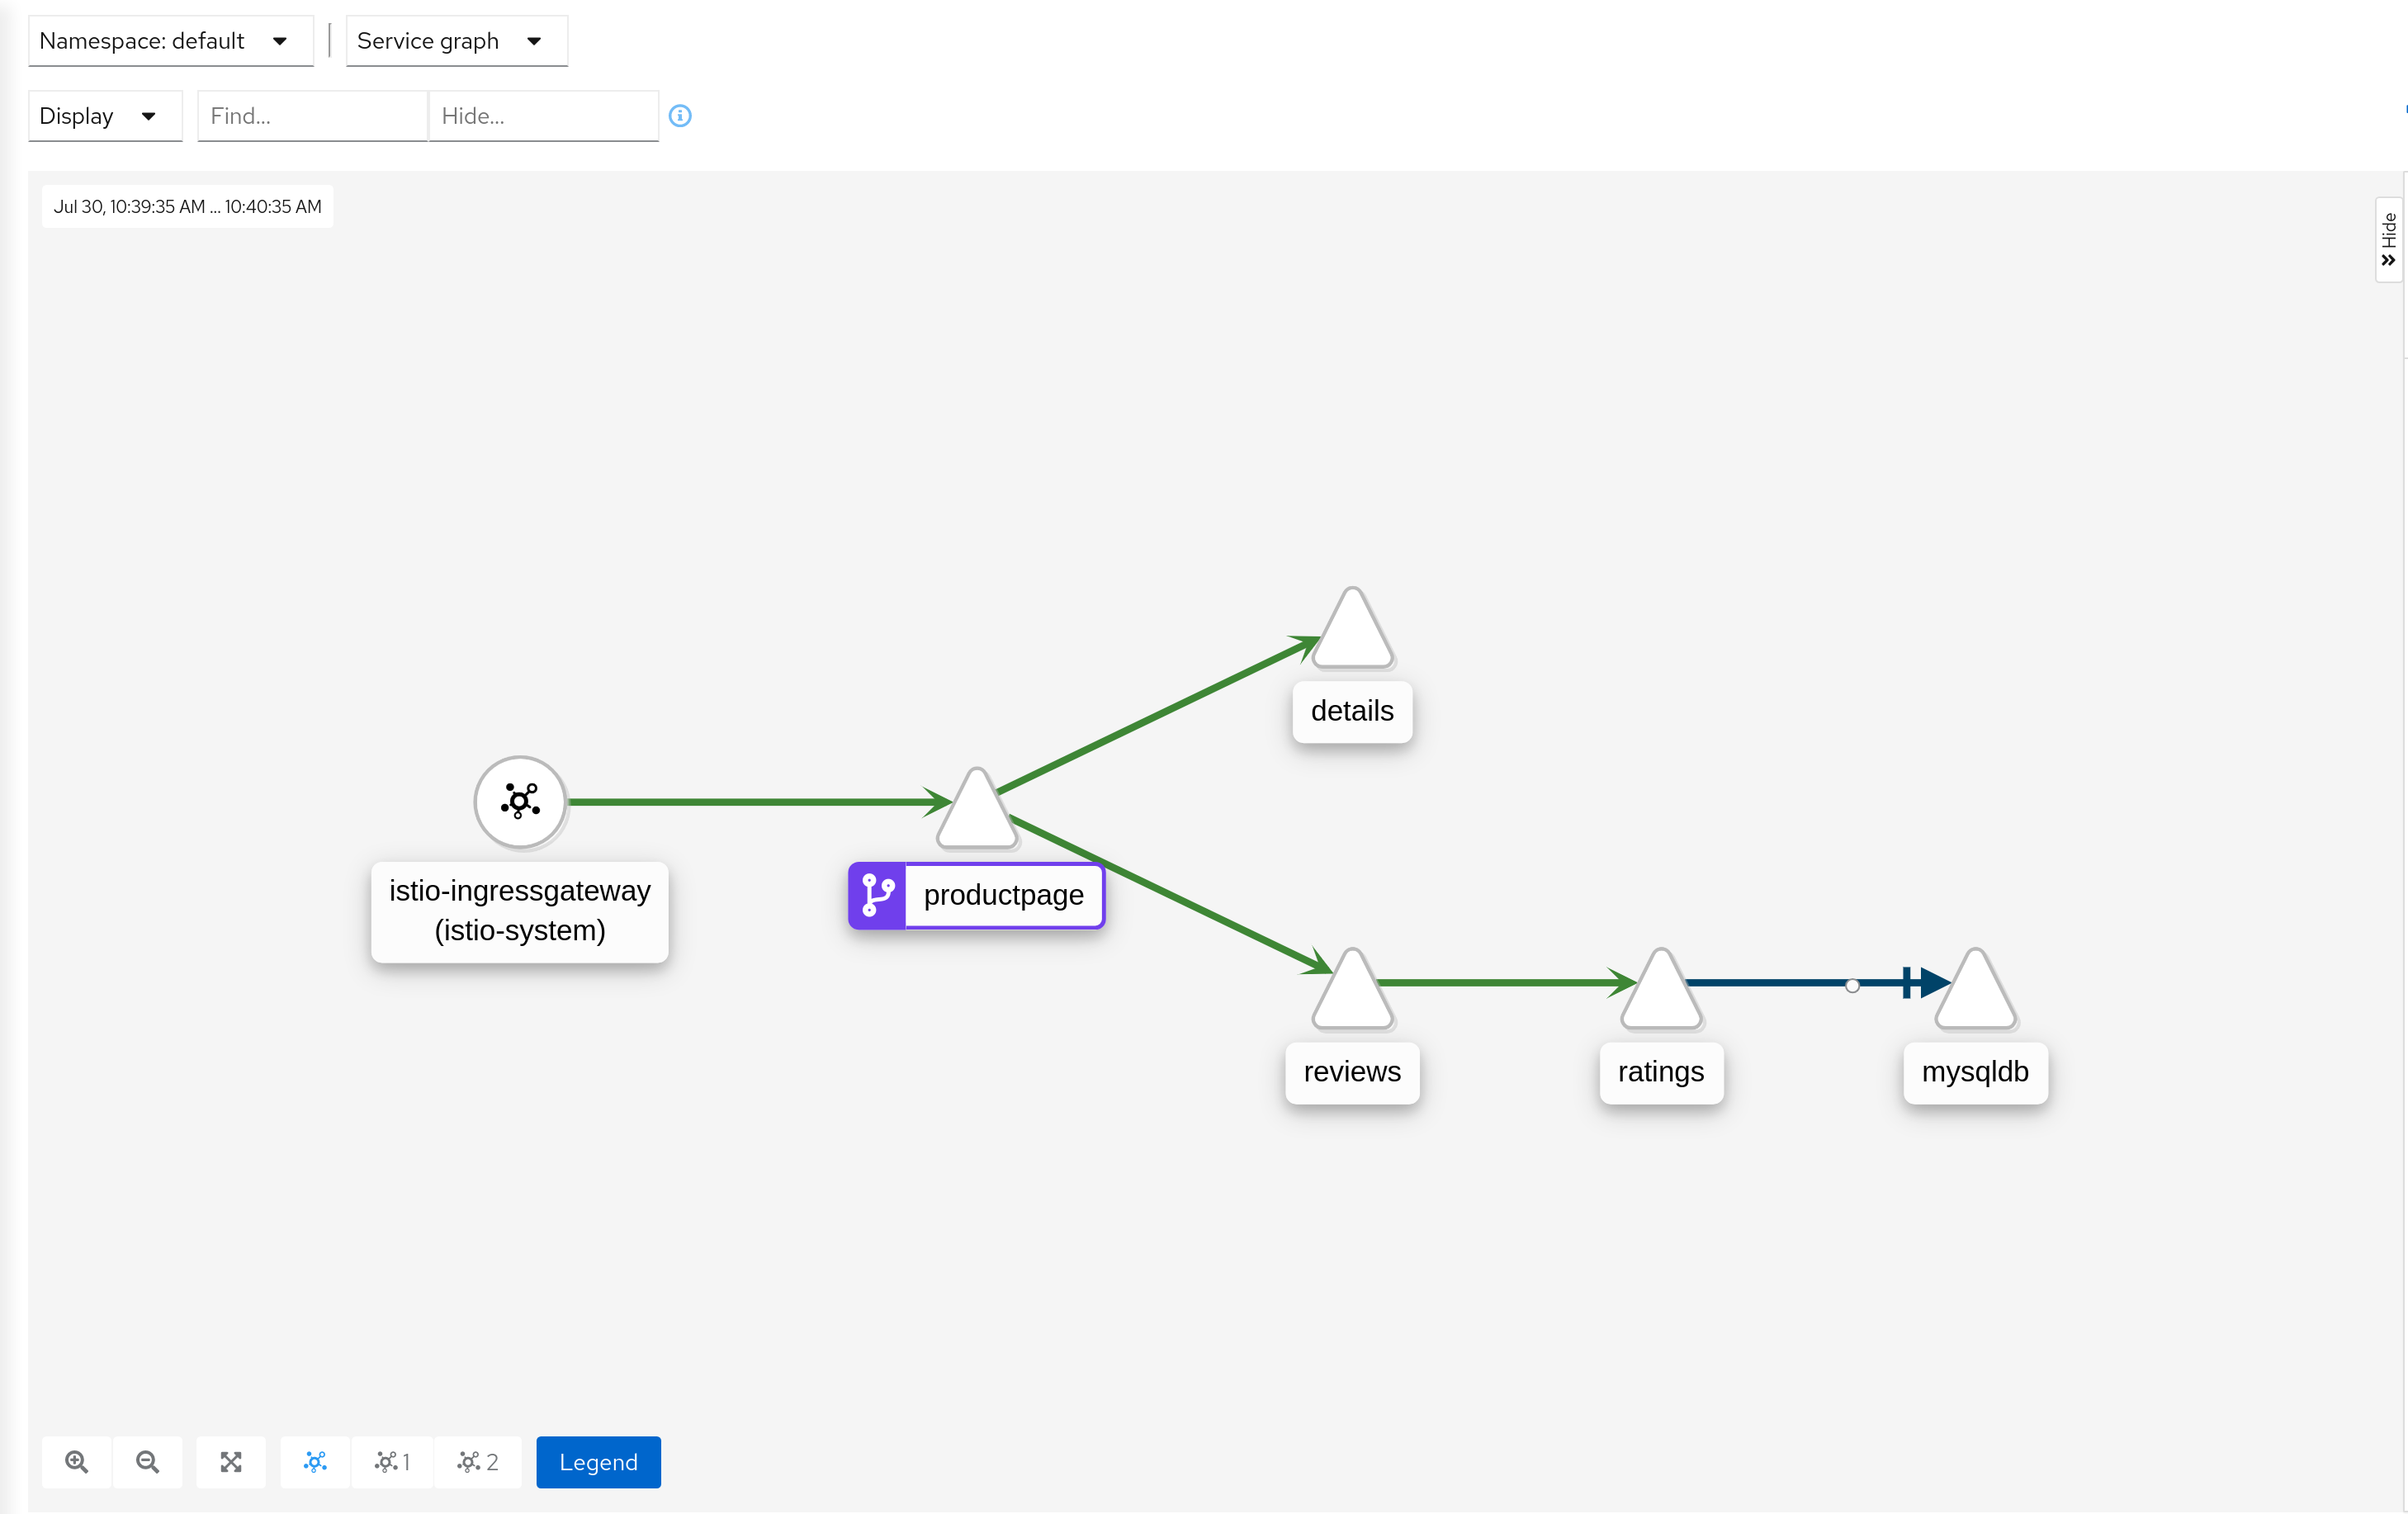
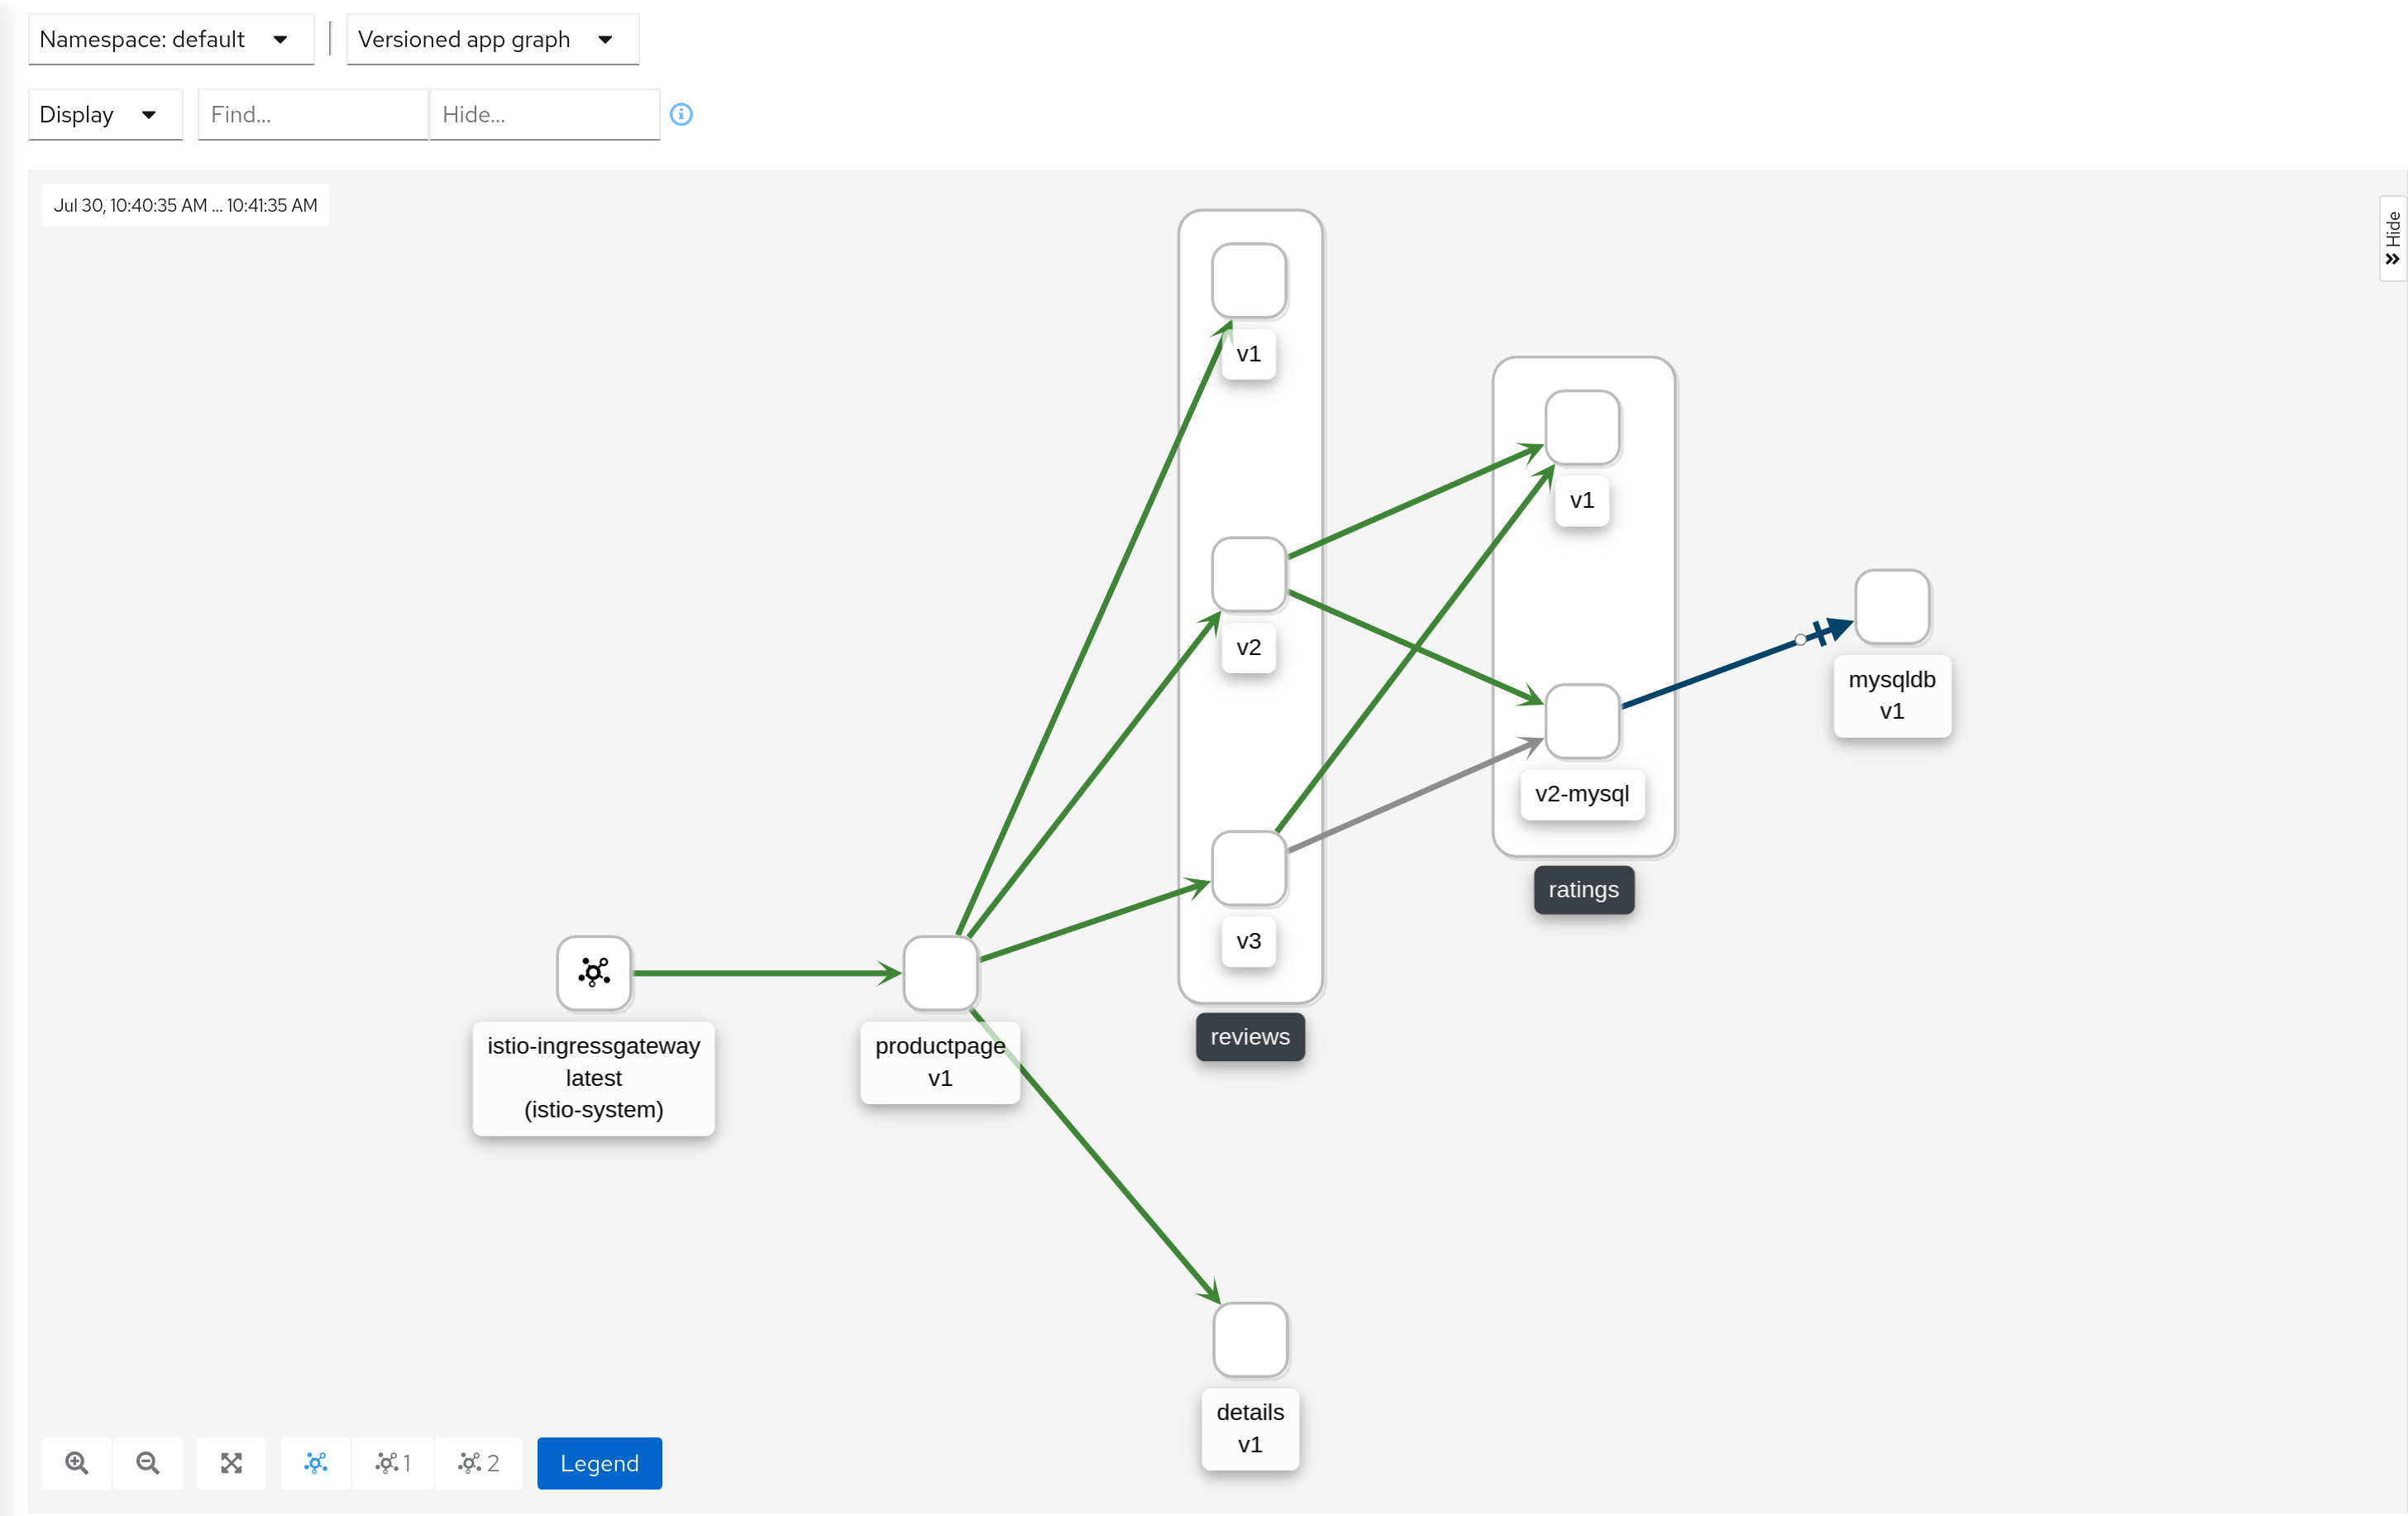
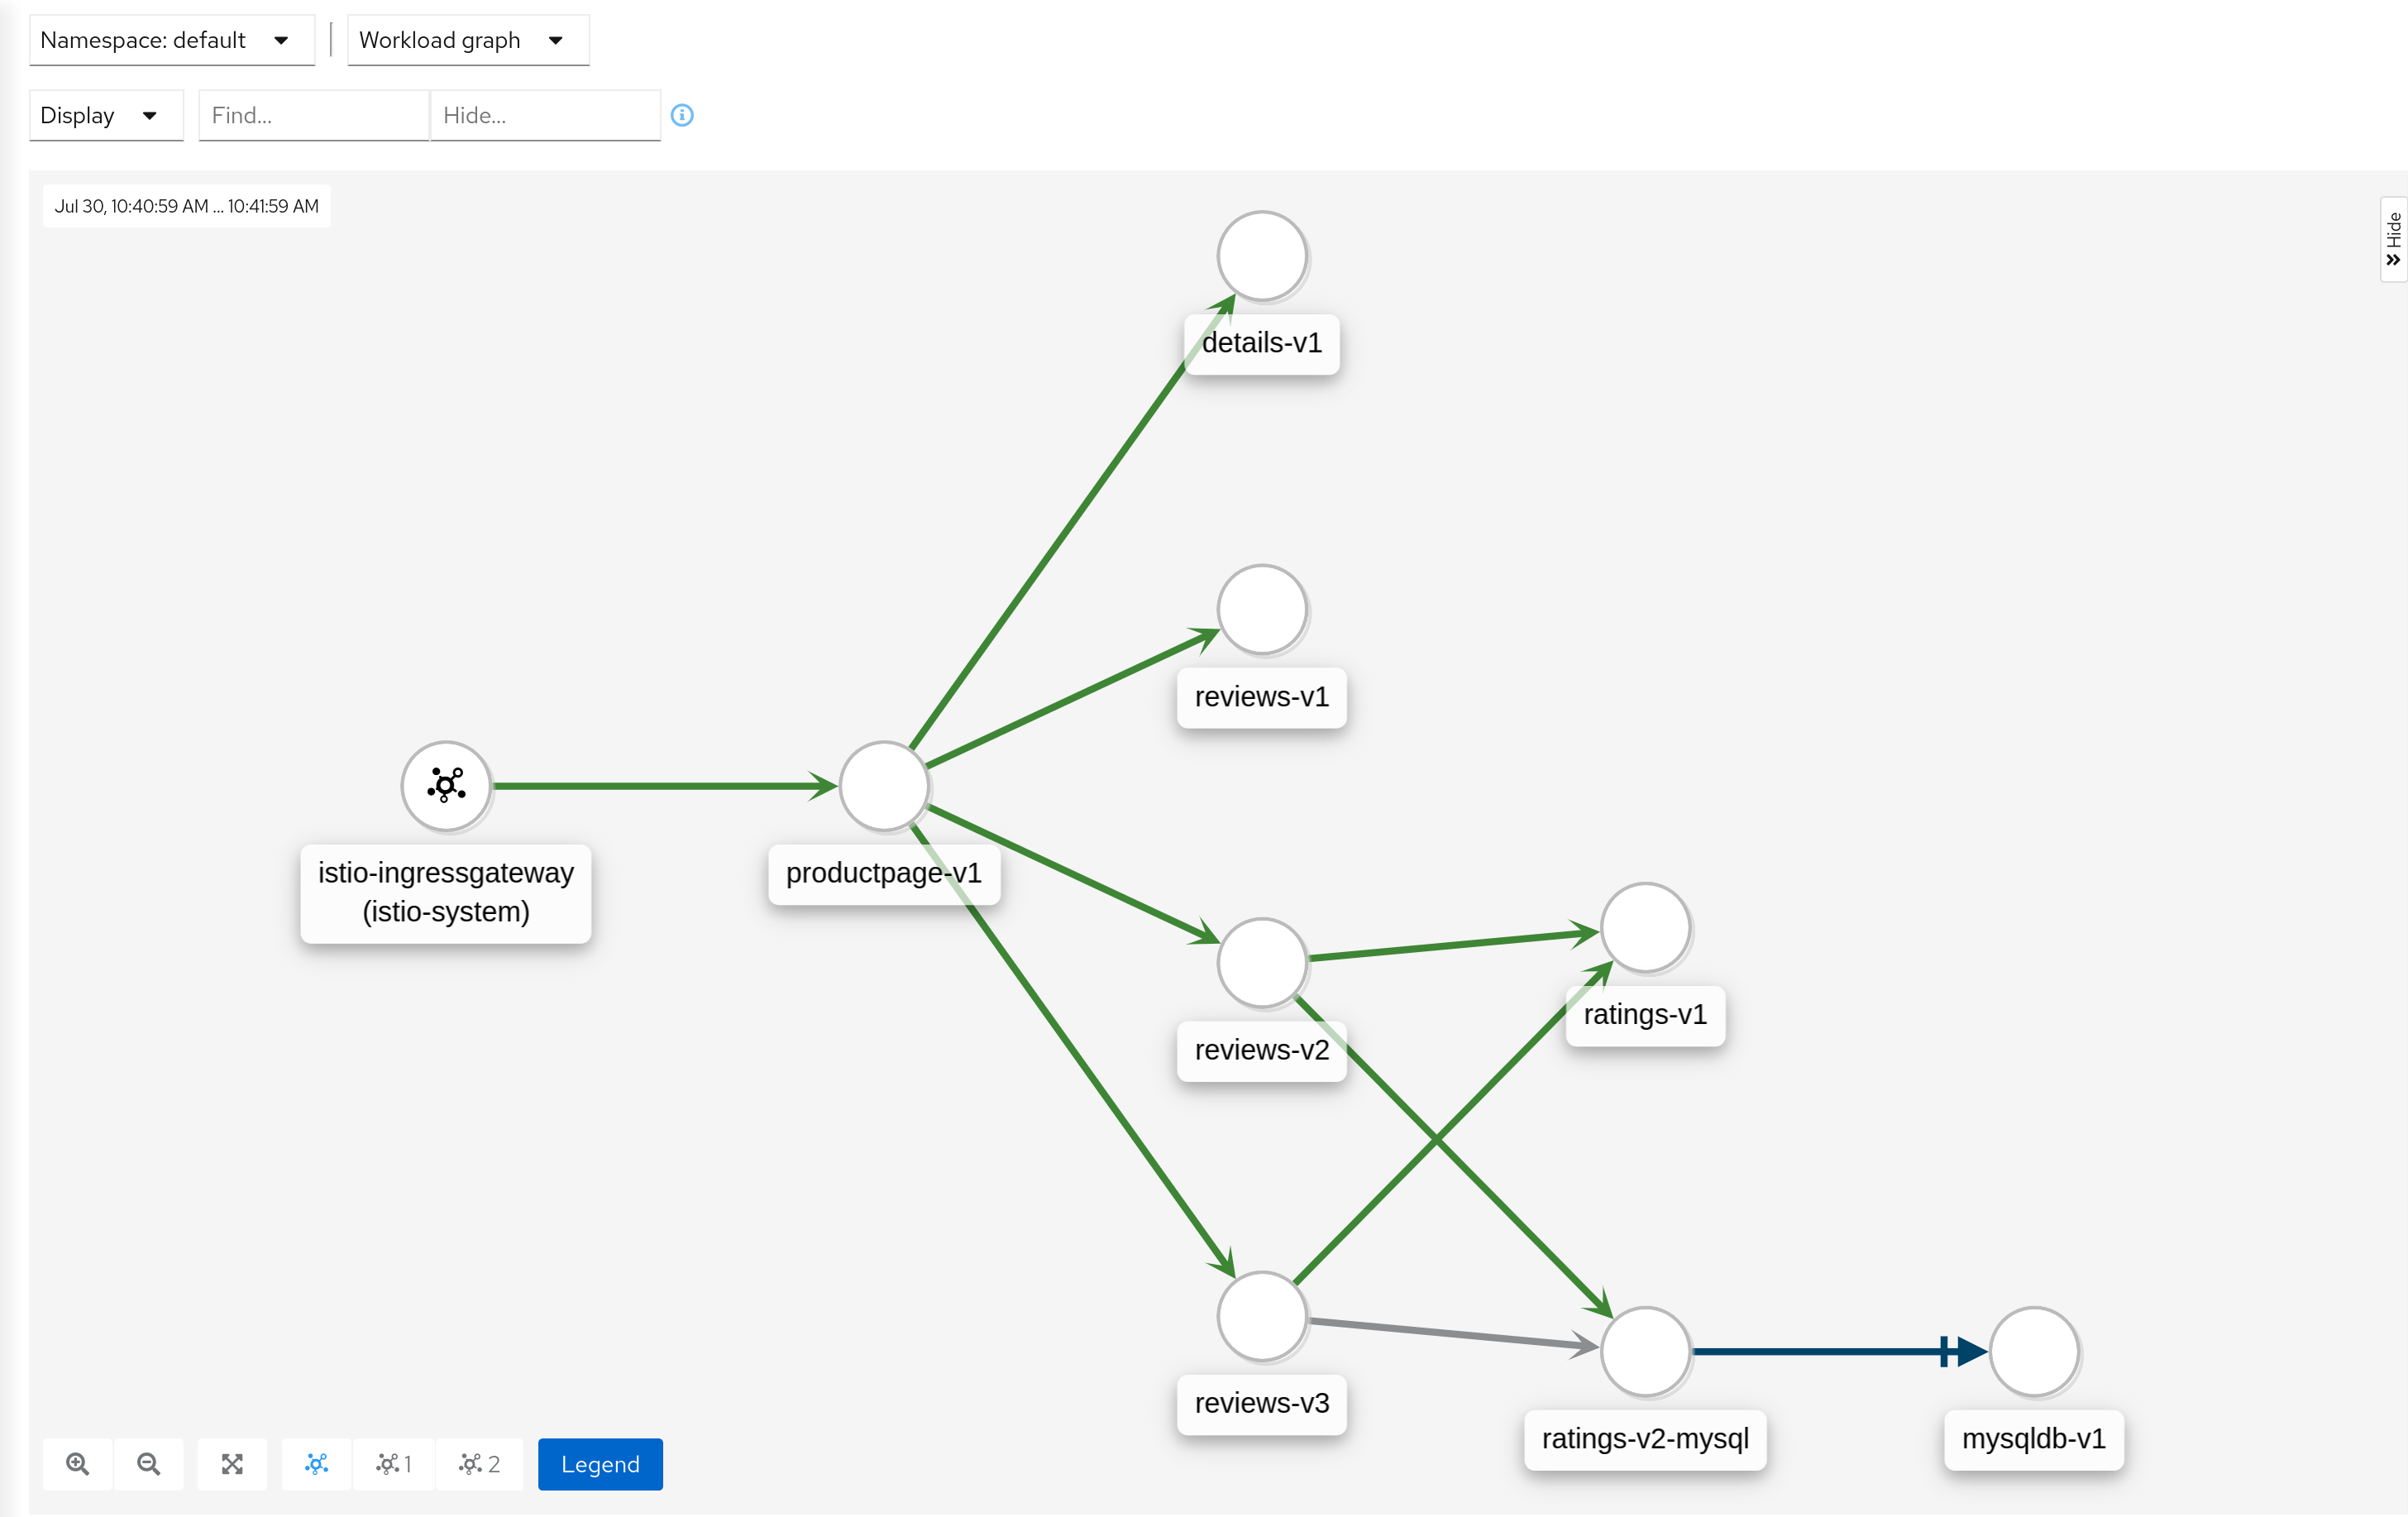
Graph: Graph Types
Kiali offers four different graph renderings of the mesh telemetry. Each graph type provides a different view of the traffic.
-
The workload graph provides the a detailed view of communication between workloads.
-
The app graph aggregates the workloads with the same app labeling, which provides a more logical view.
-
The versioned app graph aggregates by app, but breaks out the different versions providing traffic breakdowns that are version-specific.
-
The service graph provides a high-level view, which aggregates all traffic for defined services.
Graph: Replay
Graph replay is a new feature that lets you examine the past state of your service mesh.
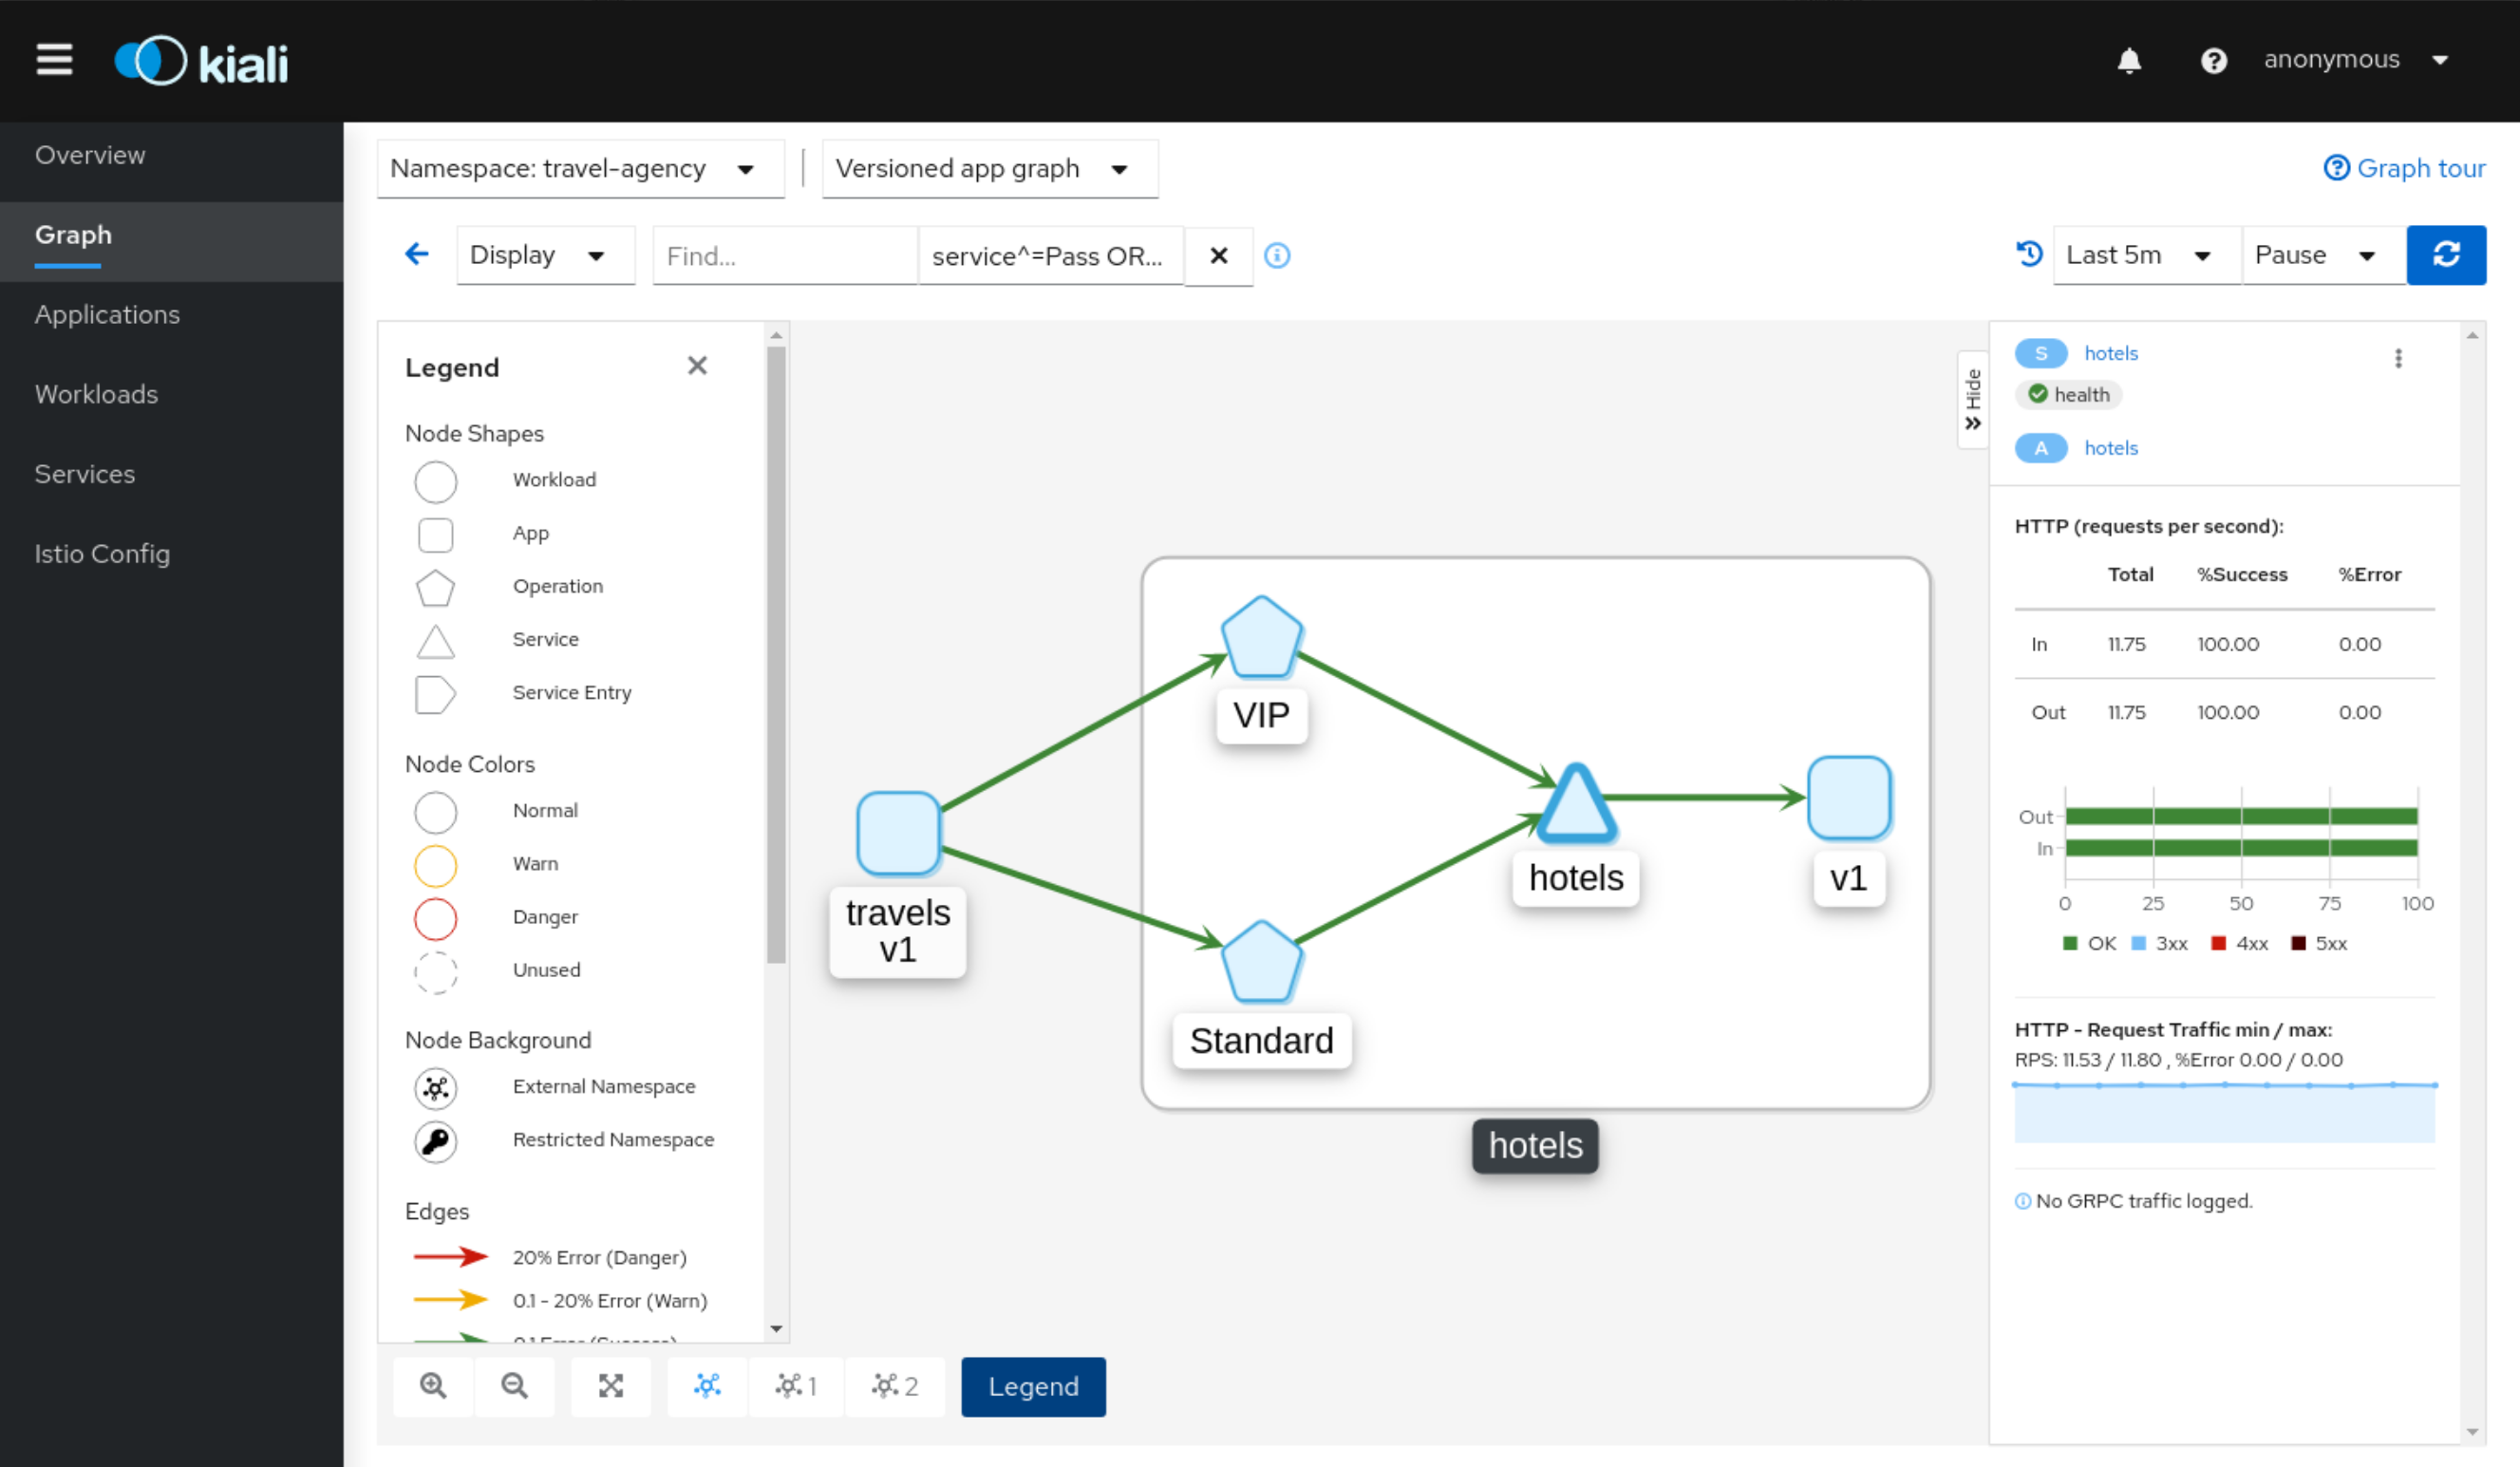
Graph: Operation Nodes
Istio v1.6 introduced Request Classification. This powerful feature allows users to classify requests into aggregates, called "Operations" by convention, to better understand how a service is being used. If configured in Istio the Kiali graph can show these as Operation nodes. The user needs only to enable the "Operation Nodes" display option. Operations can span services, for example, "VIP" may be configured for both CarRental and HotelRental services. To see total "VIP" traffic then display operation nodes without service nodes. To see "VIP" traffic specific to each service then also enable the "Service Nodes" display option.
When selected, an Operation node also provides a side-panel view. And when double-clicked a node detail graph is also provided.
Because operation nodes represent aggregate traffic they are not compatible with Service graphs, which themselves are already logical aggregates. For similar reasons response time information is not available on edges leading into or out of operation nodes. But by selecting the edge the response time information is available in the side panel (if configured).
Operation nodes are represented as pentagons in the Kiali graph:
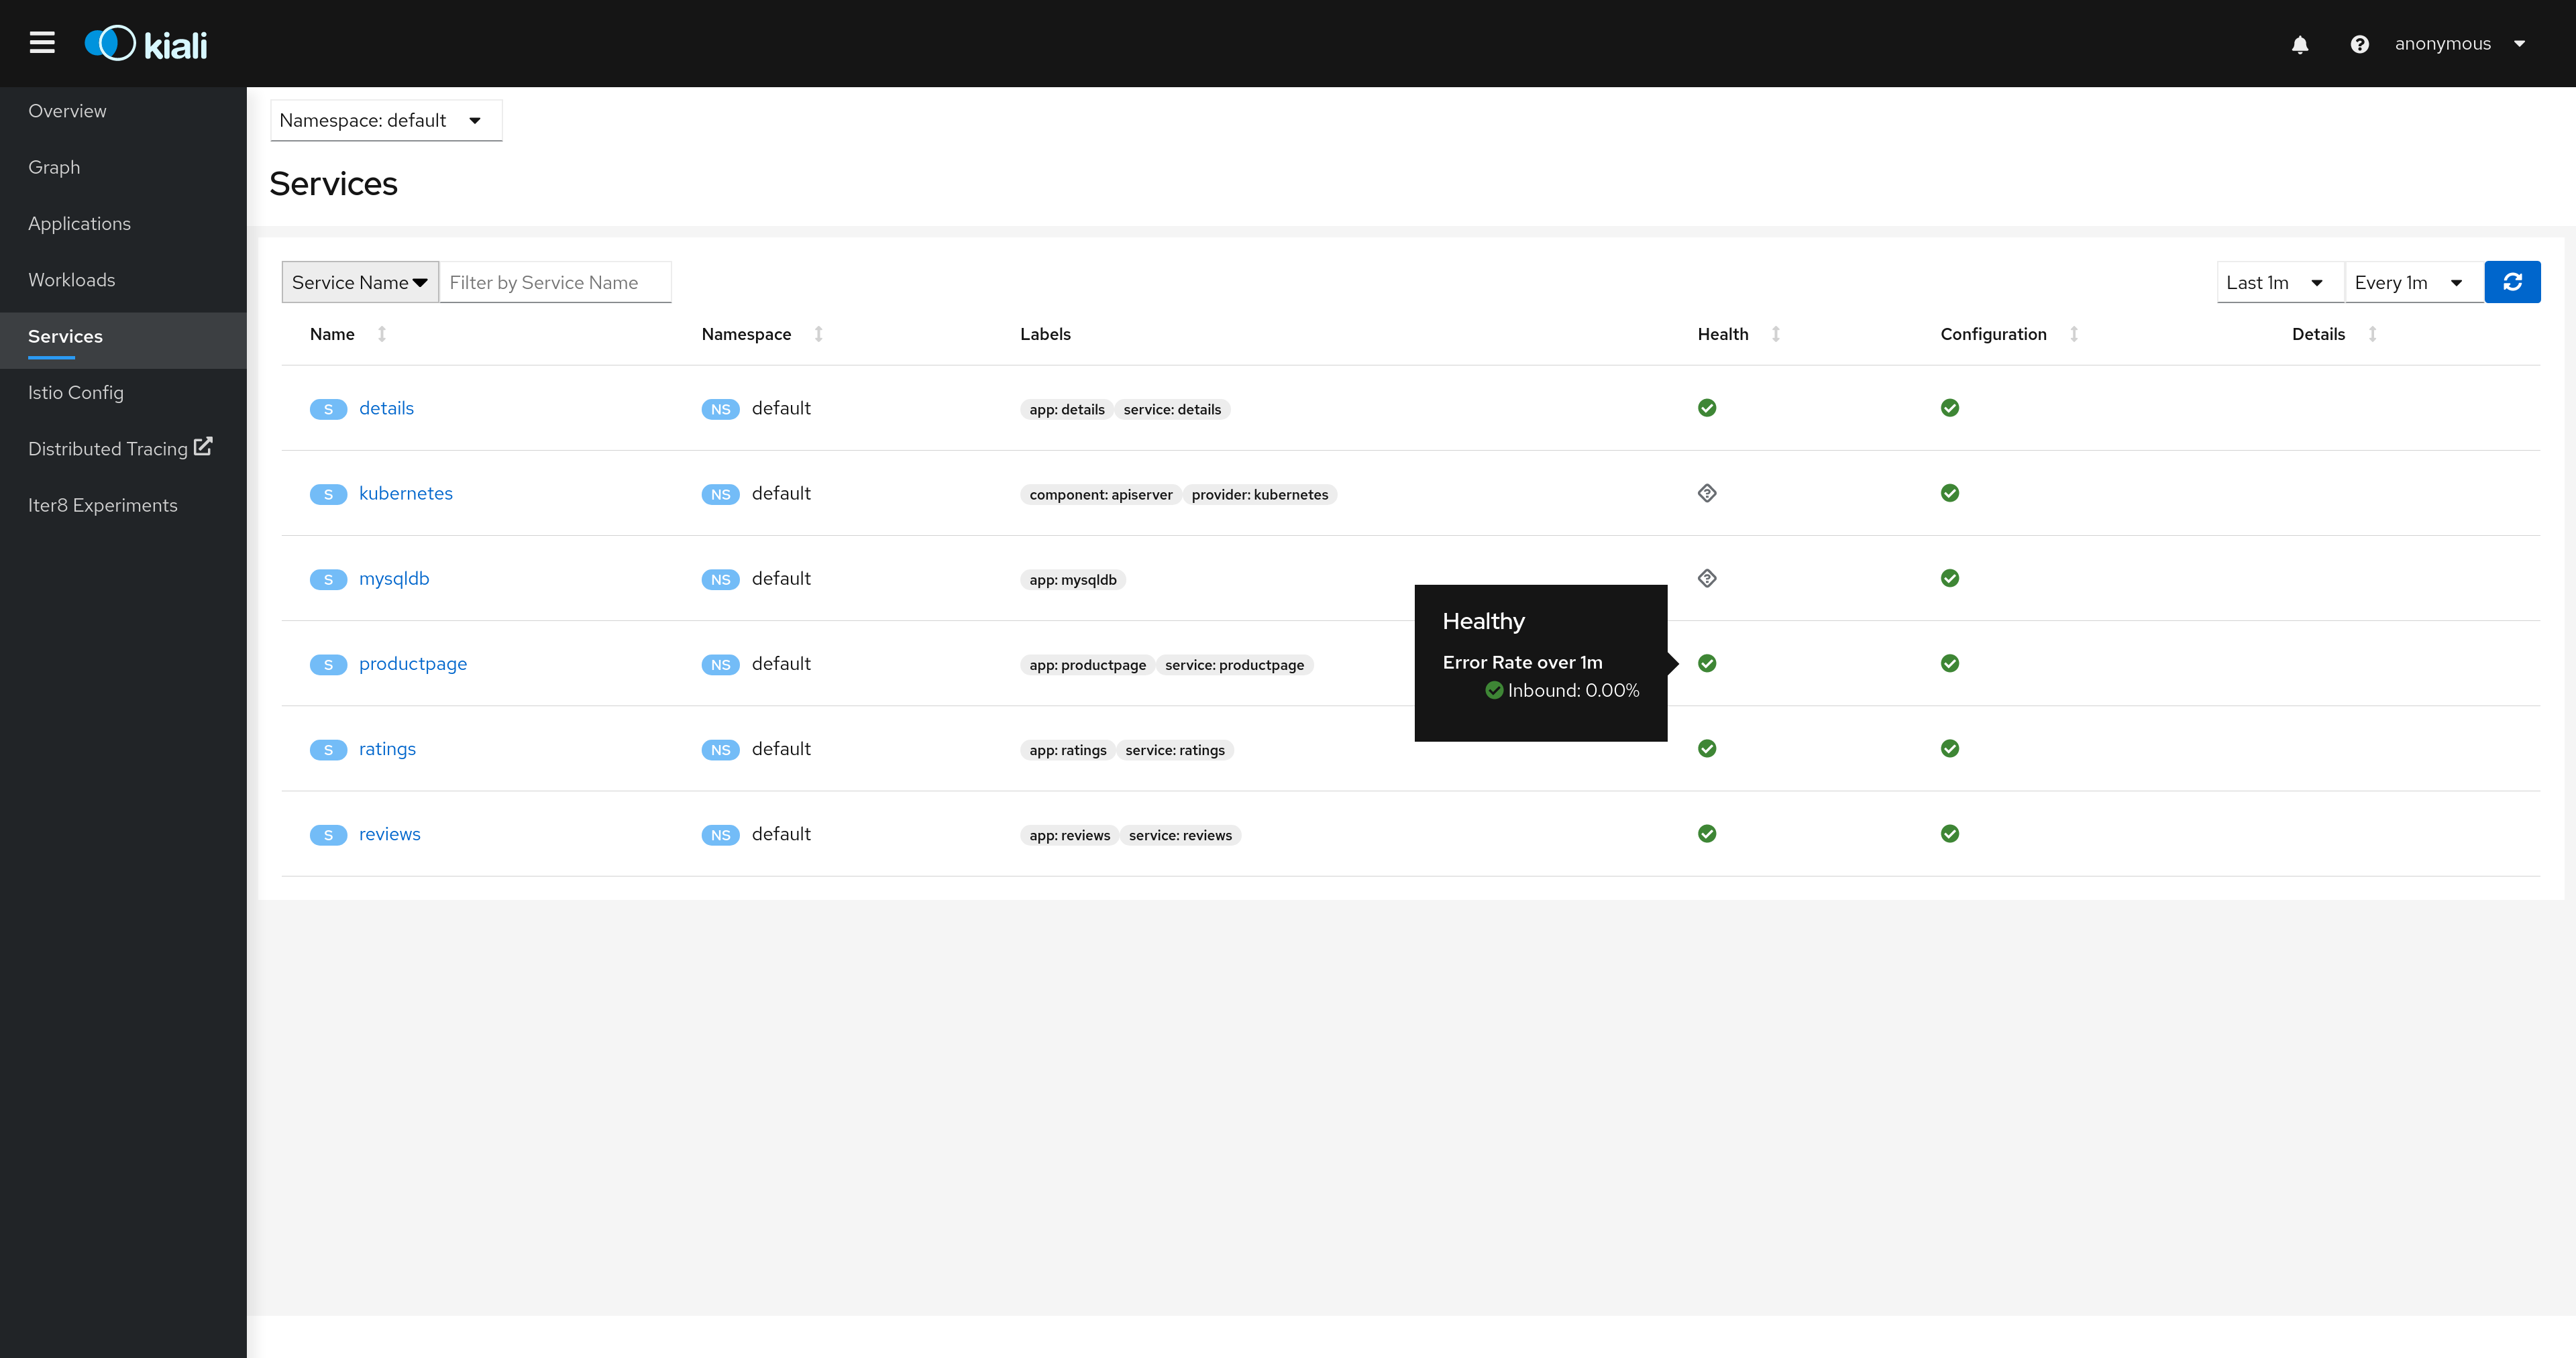
Detail Views
Kiali provides filtered list views of all your service mesh definitions. Each view provides health, details, YAML definitions and links to help you visualize your mesh. There are list and detail views for:
-
Services
-
Applications
-
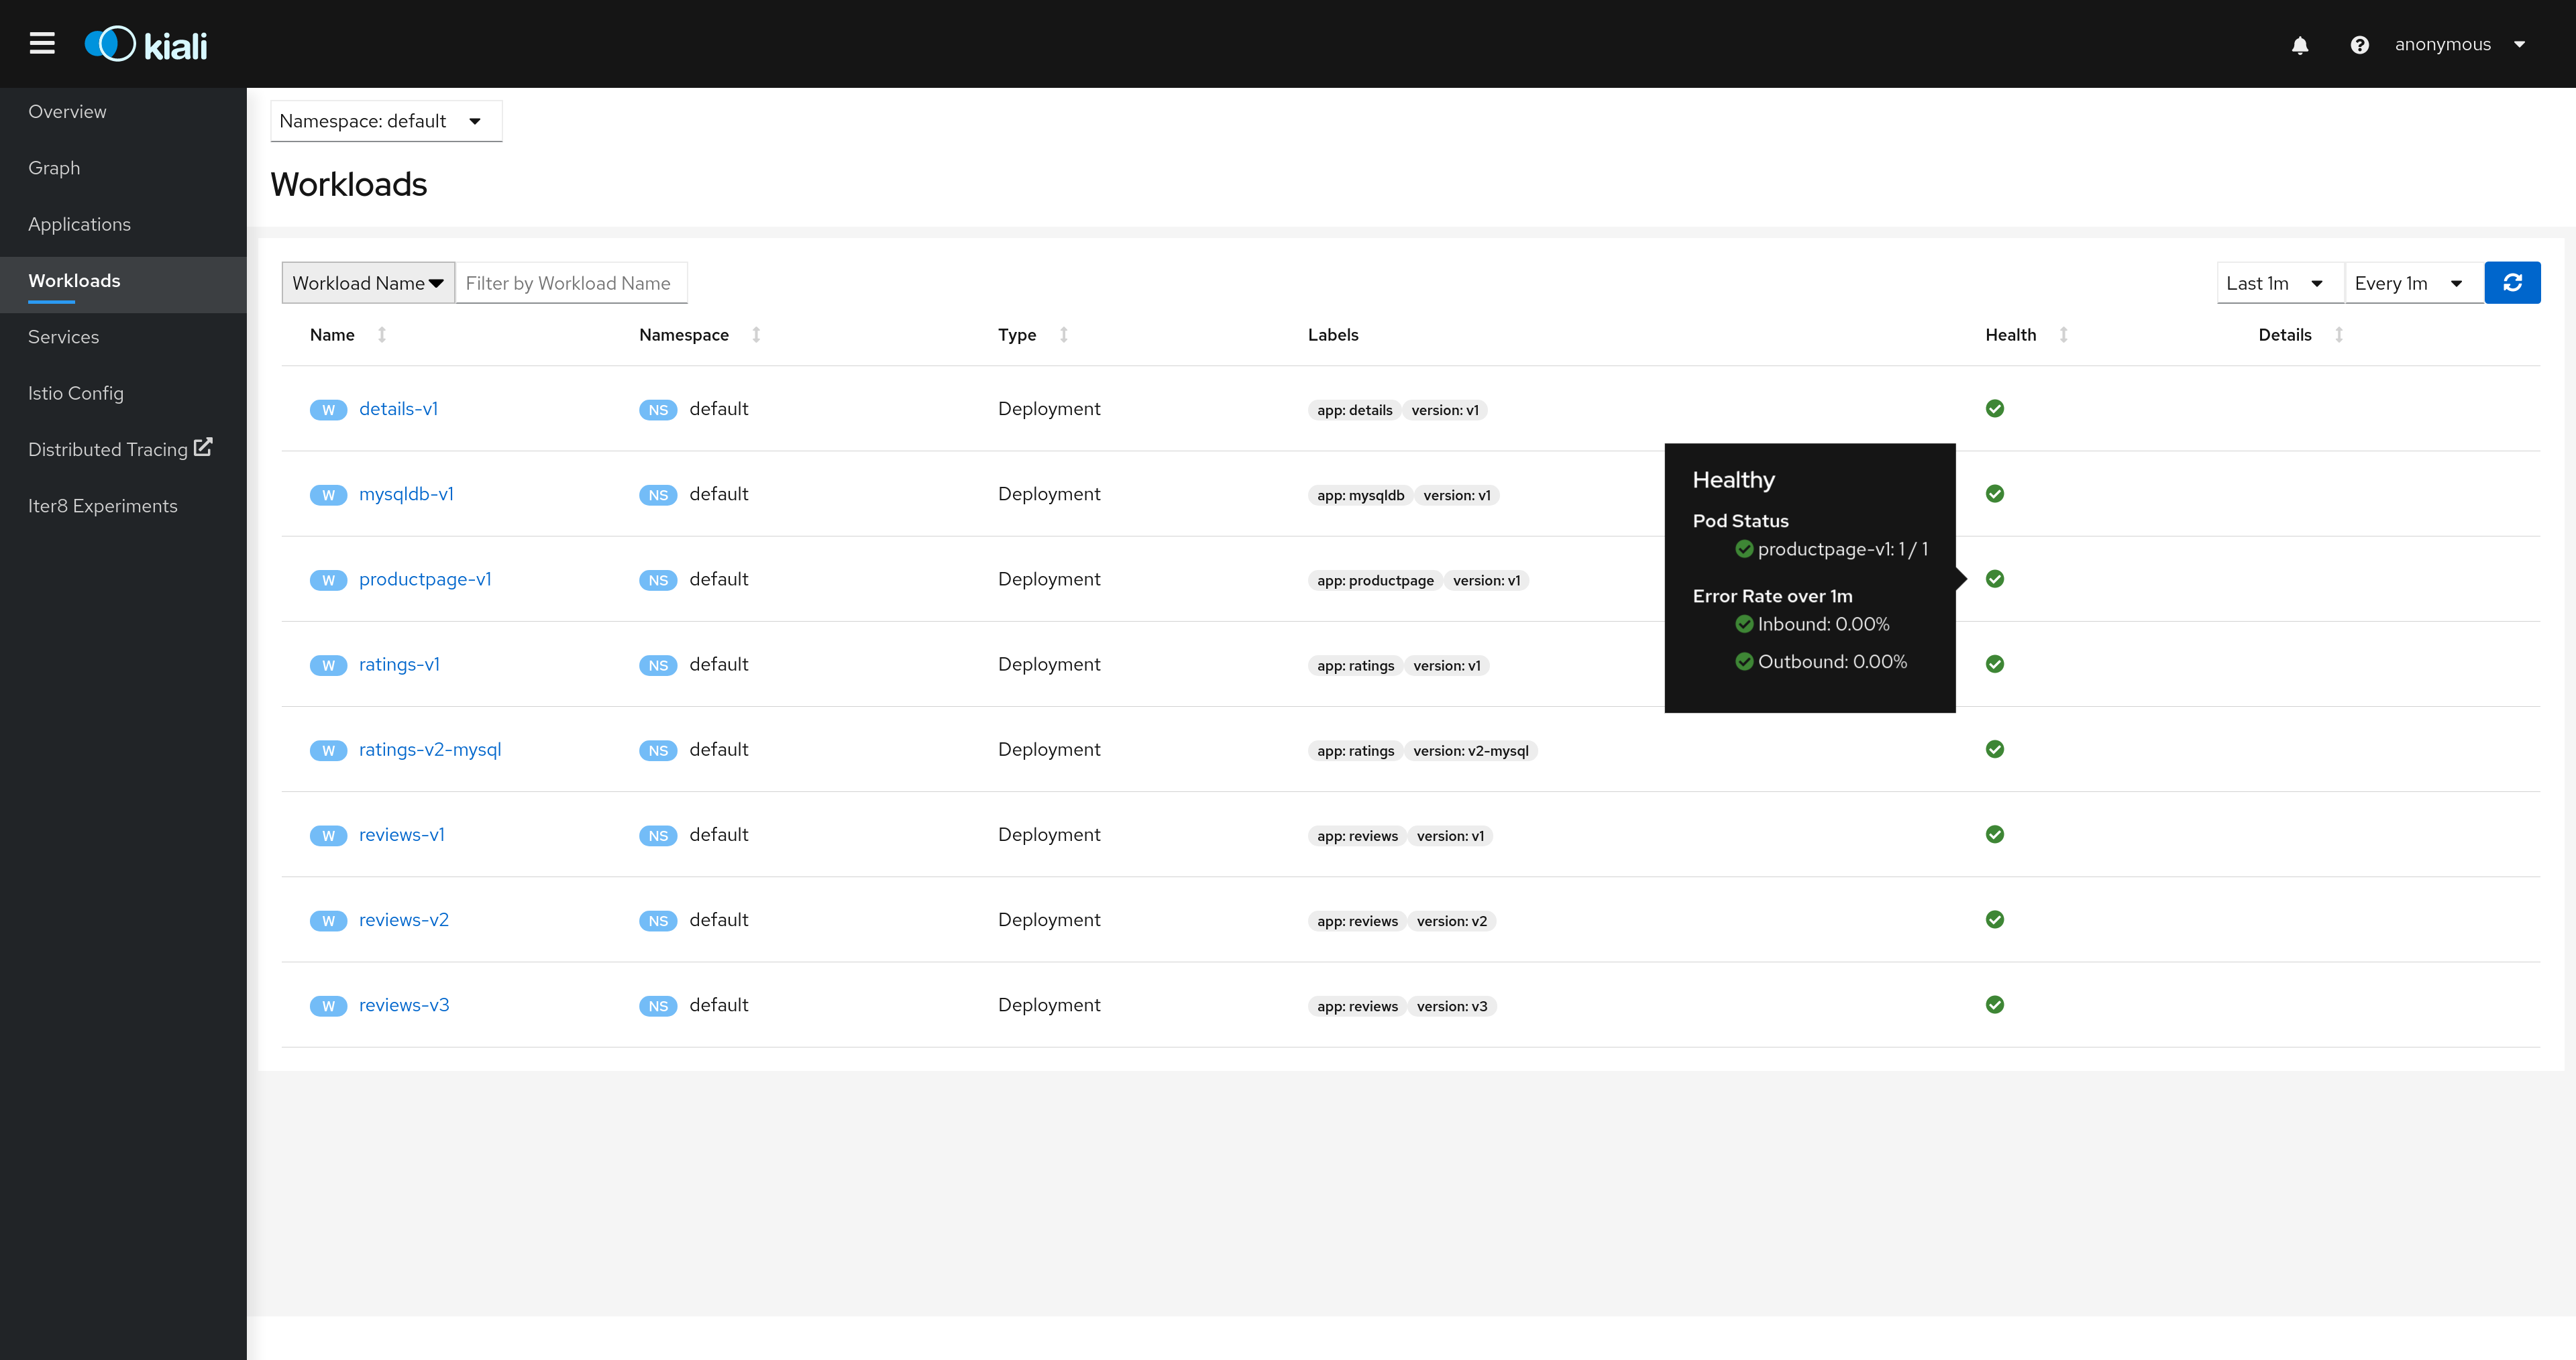
Workloads
-
Istio Configuration
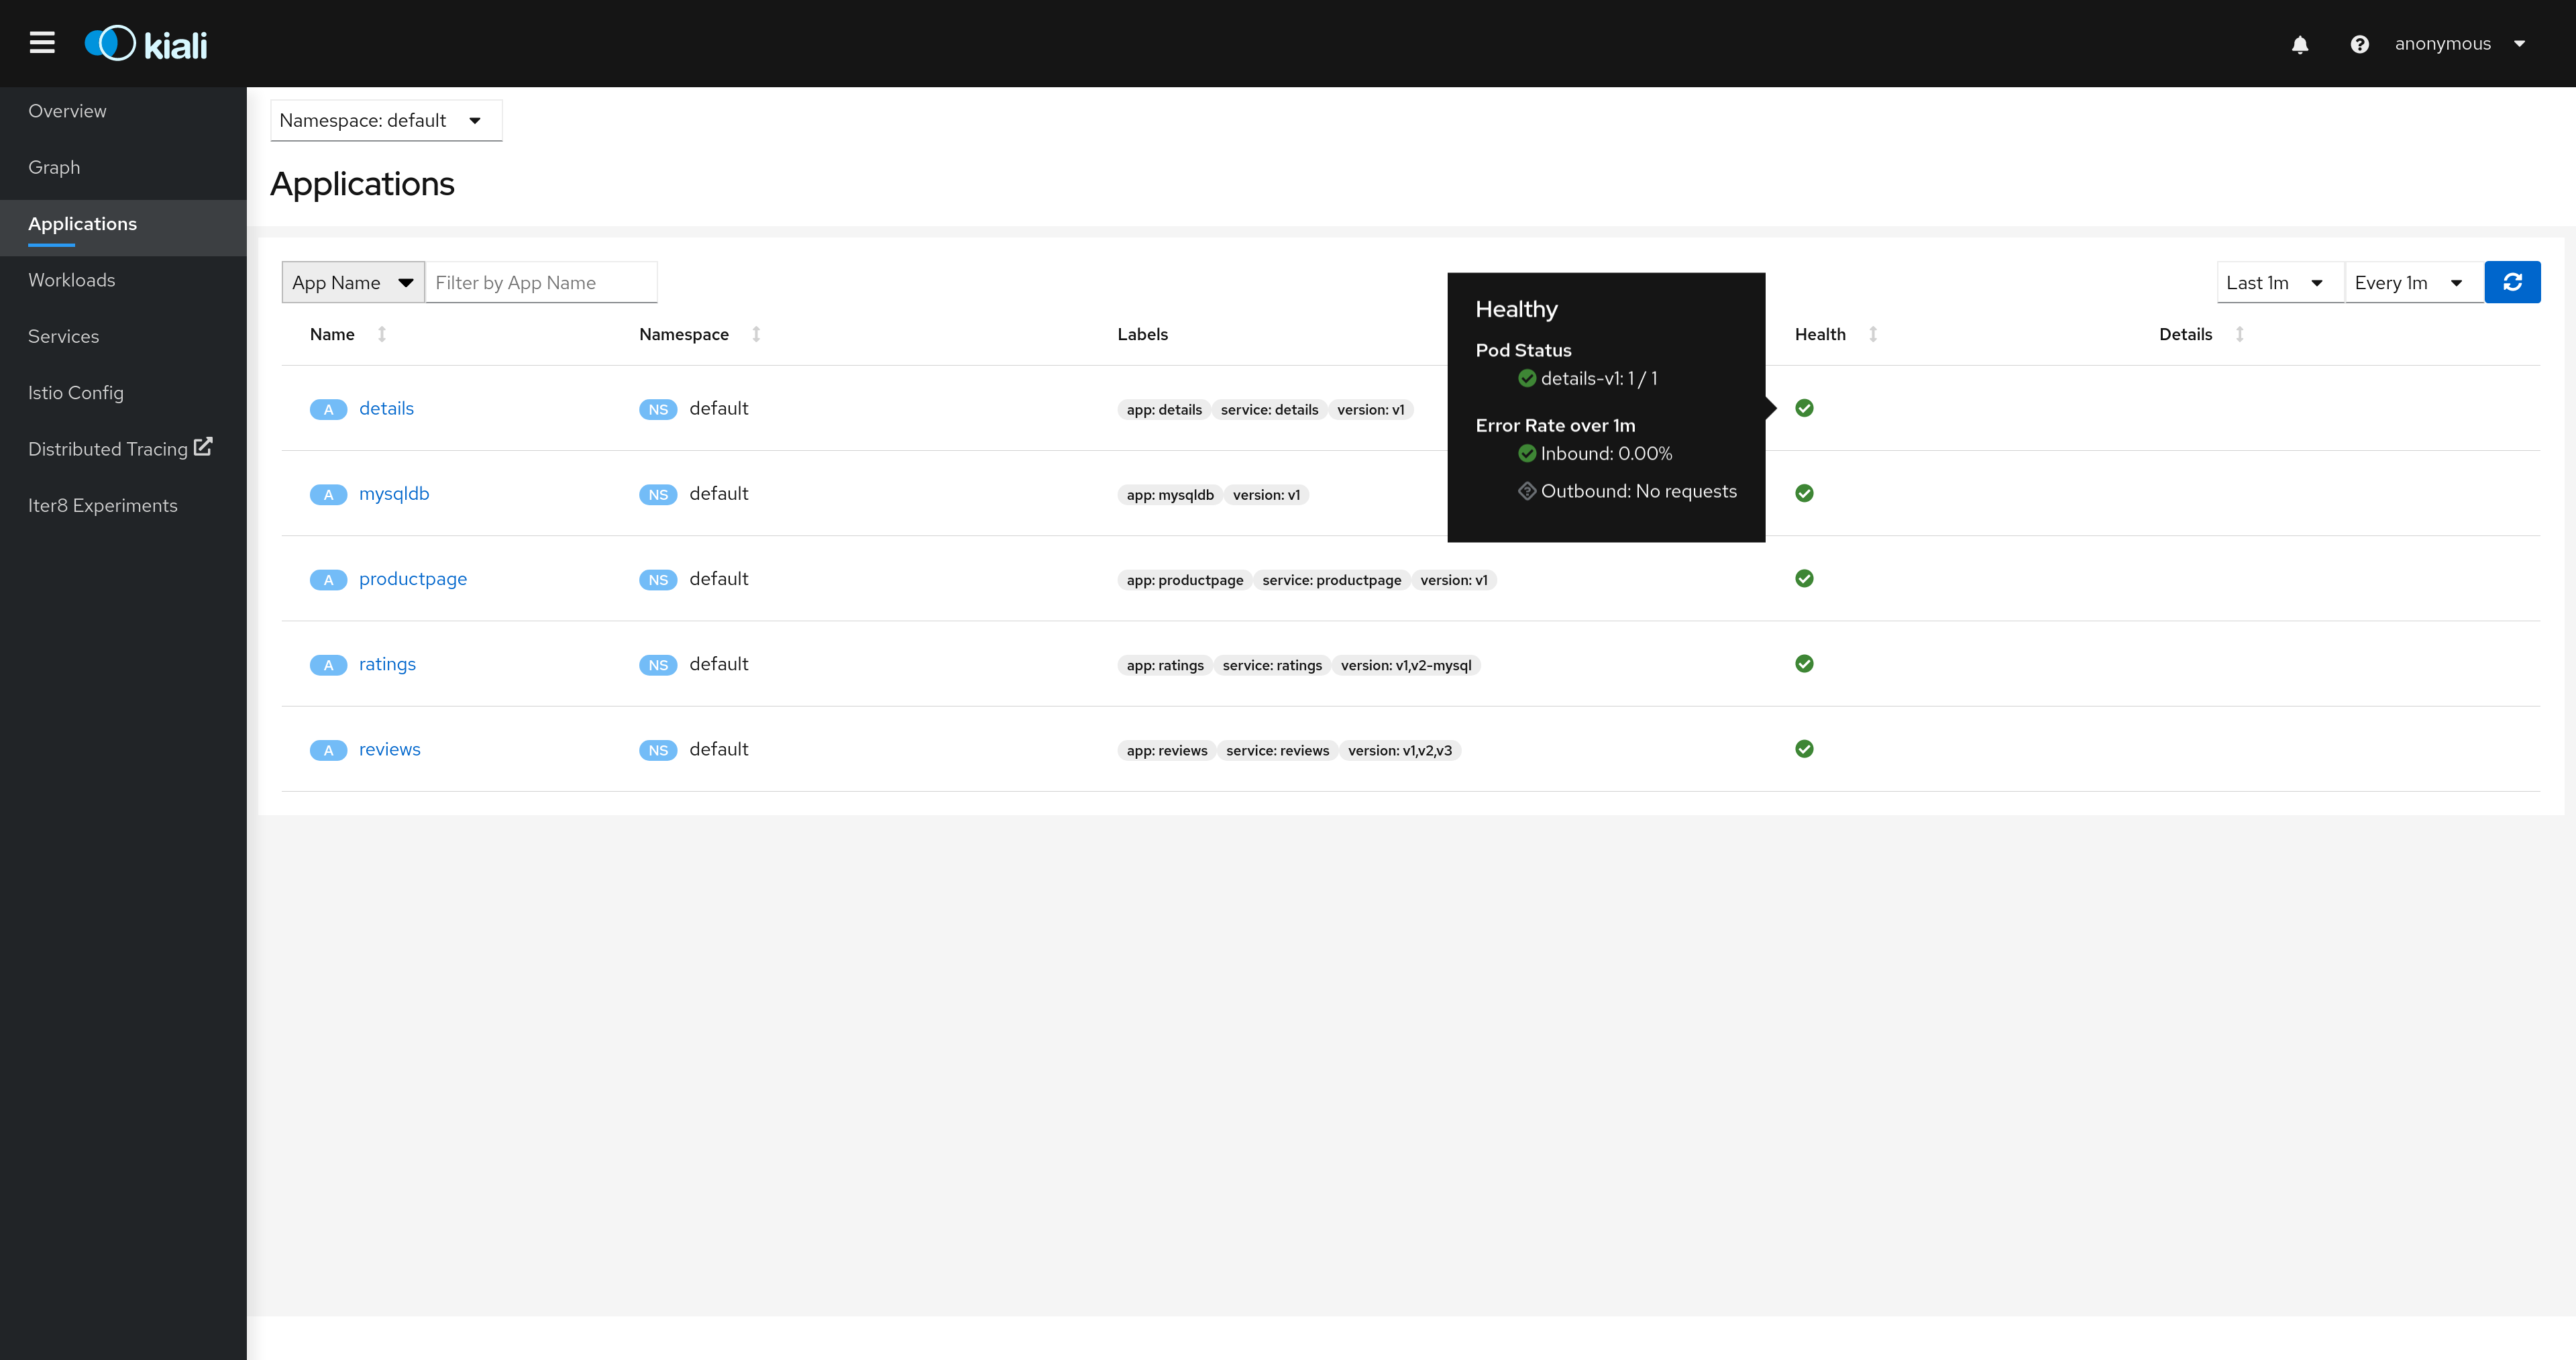
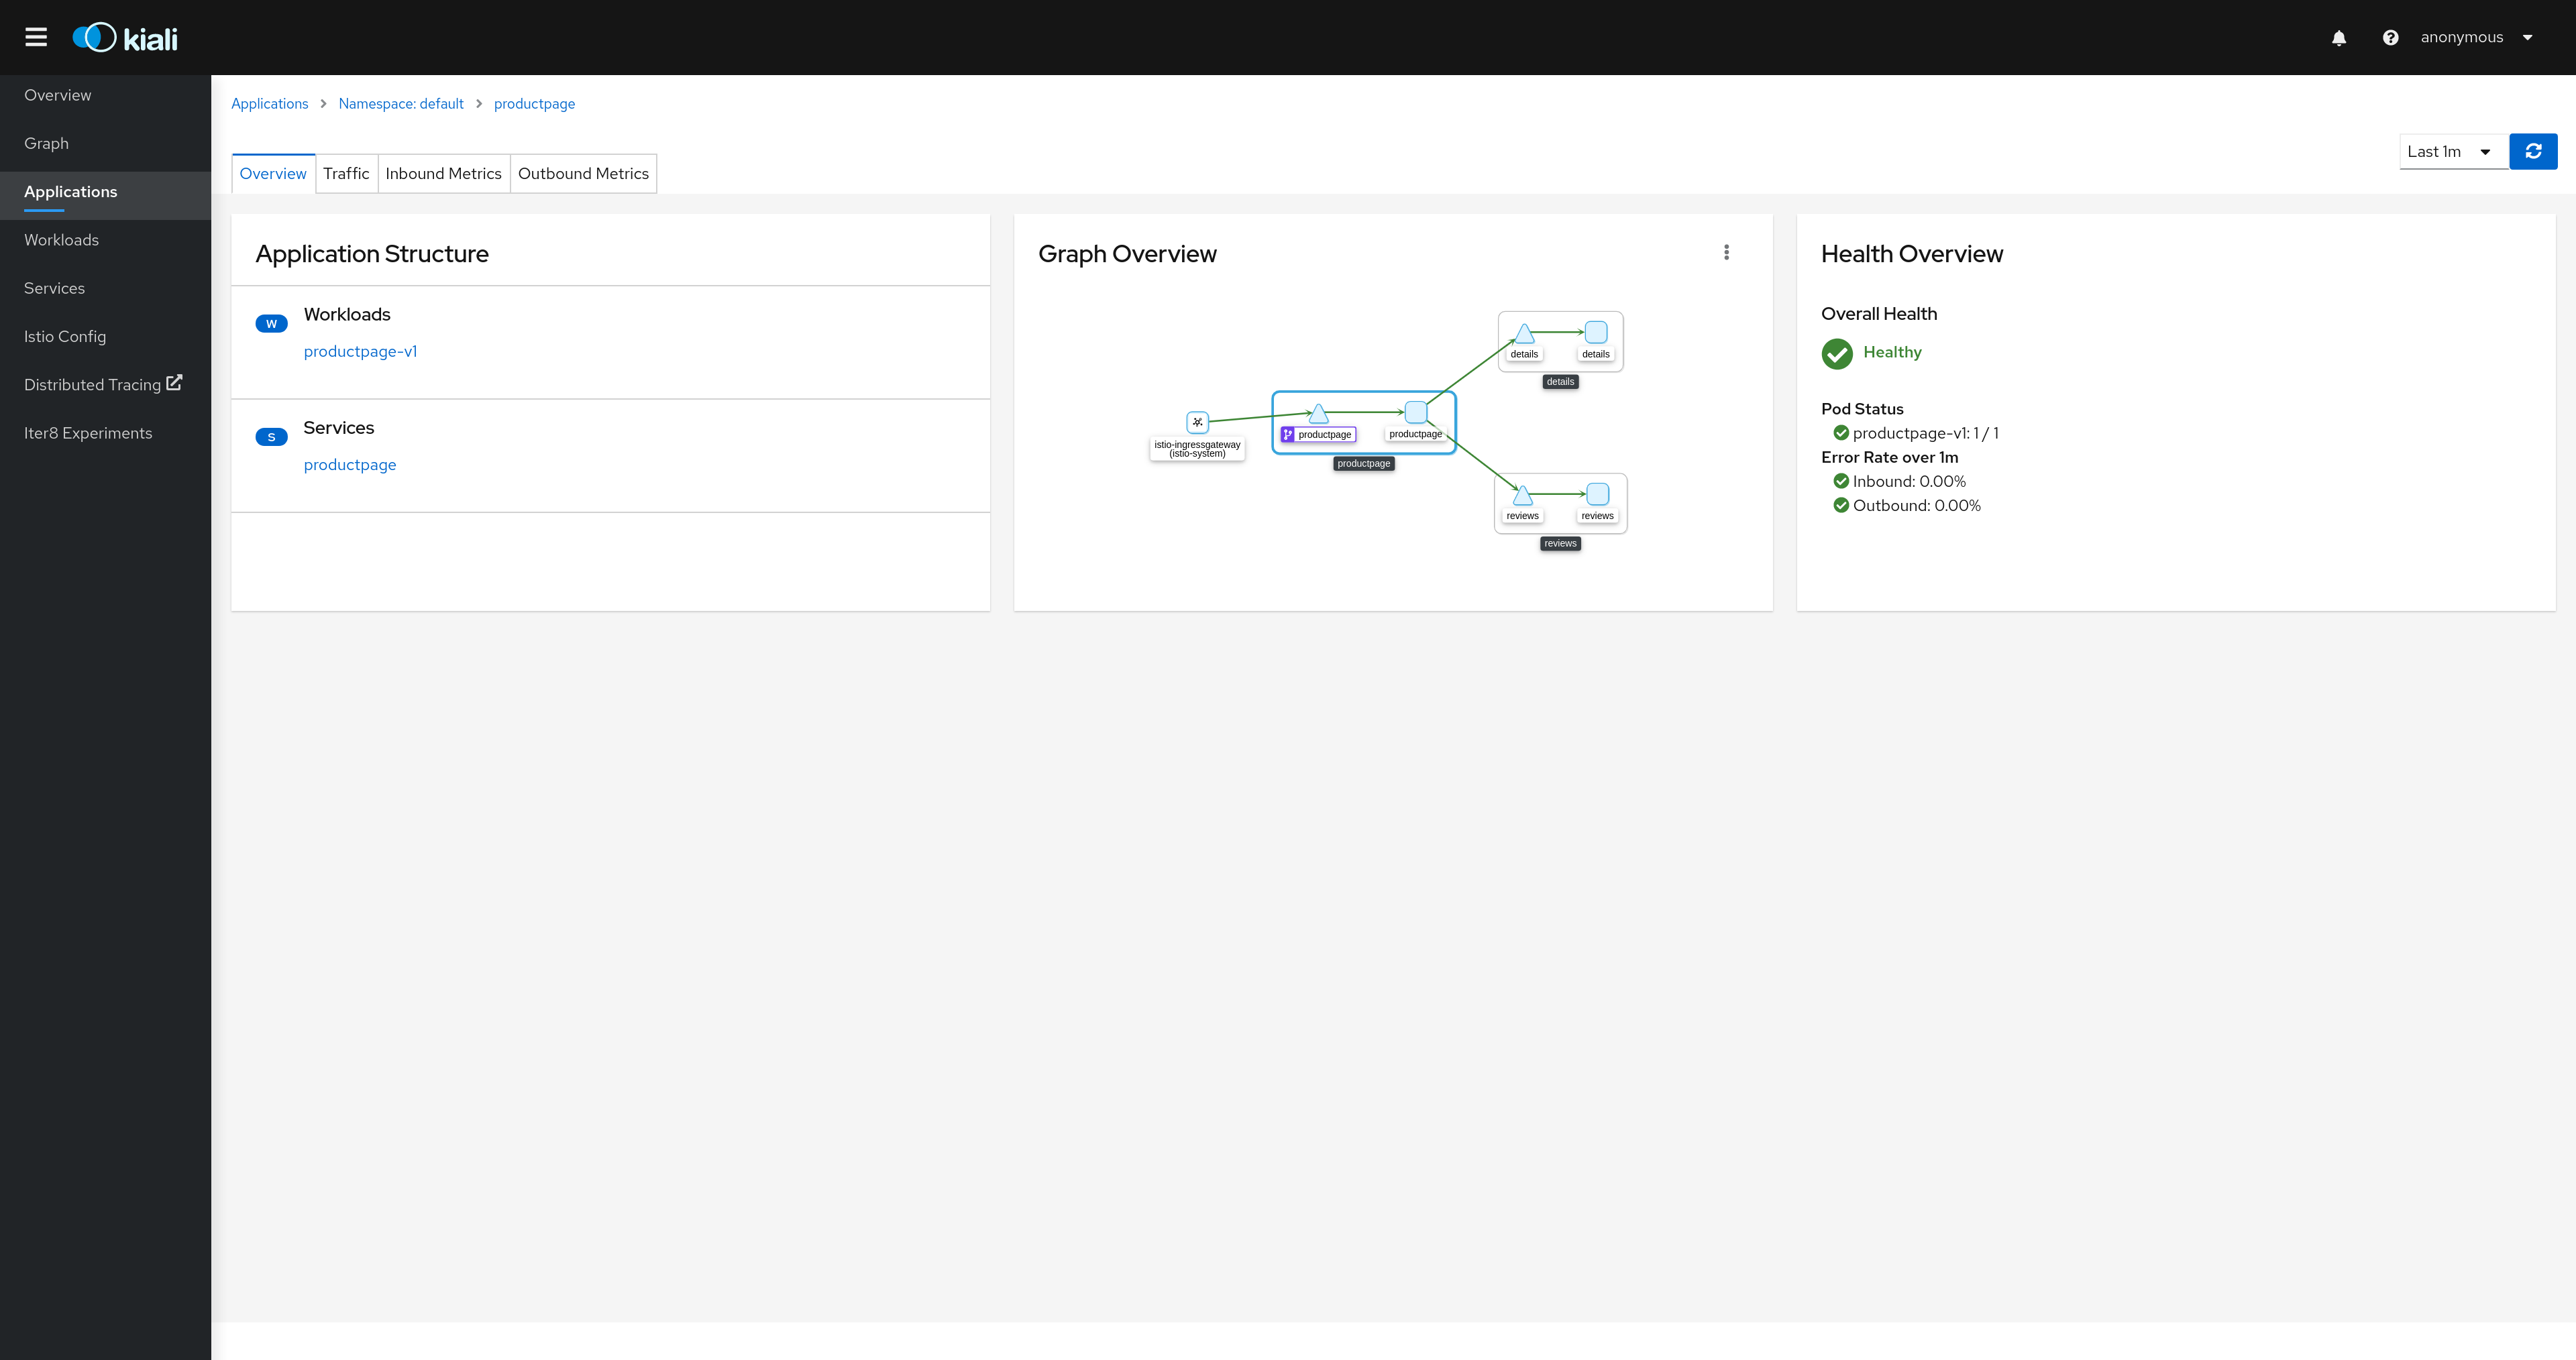
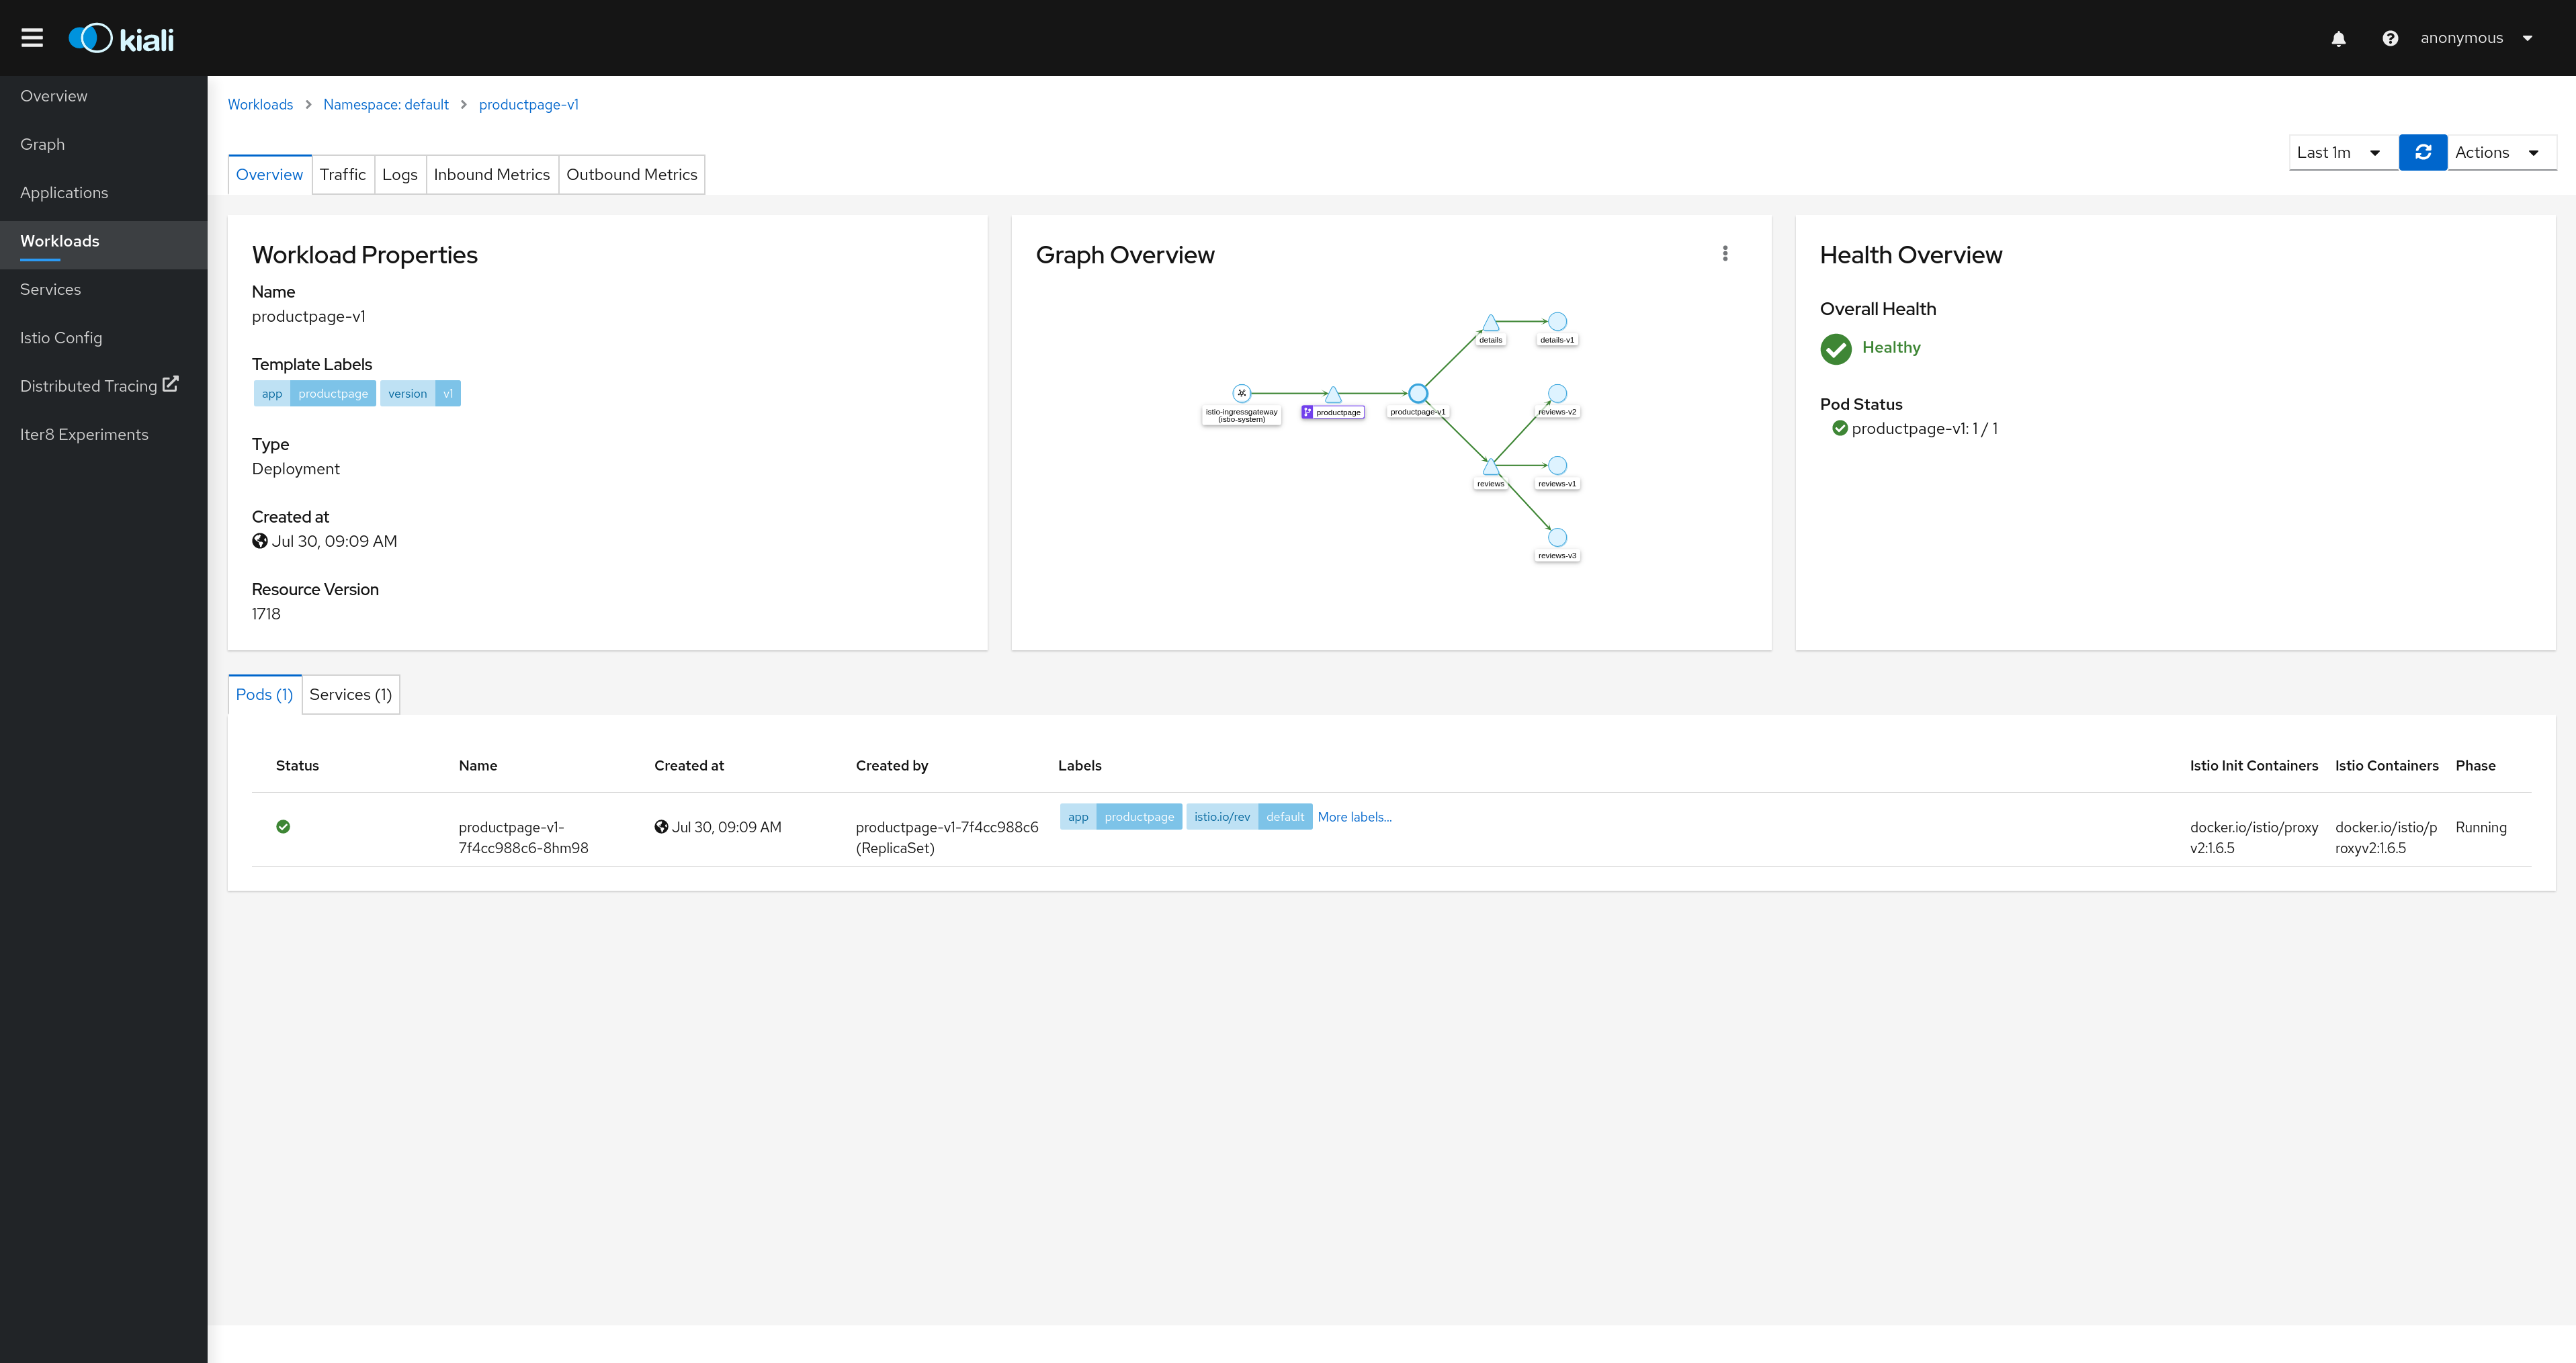
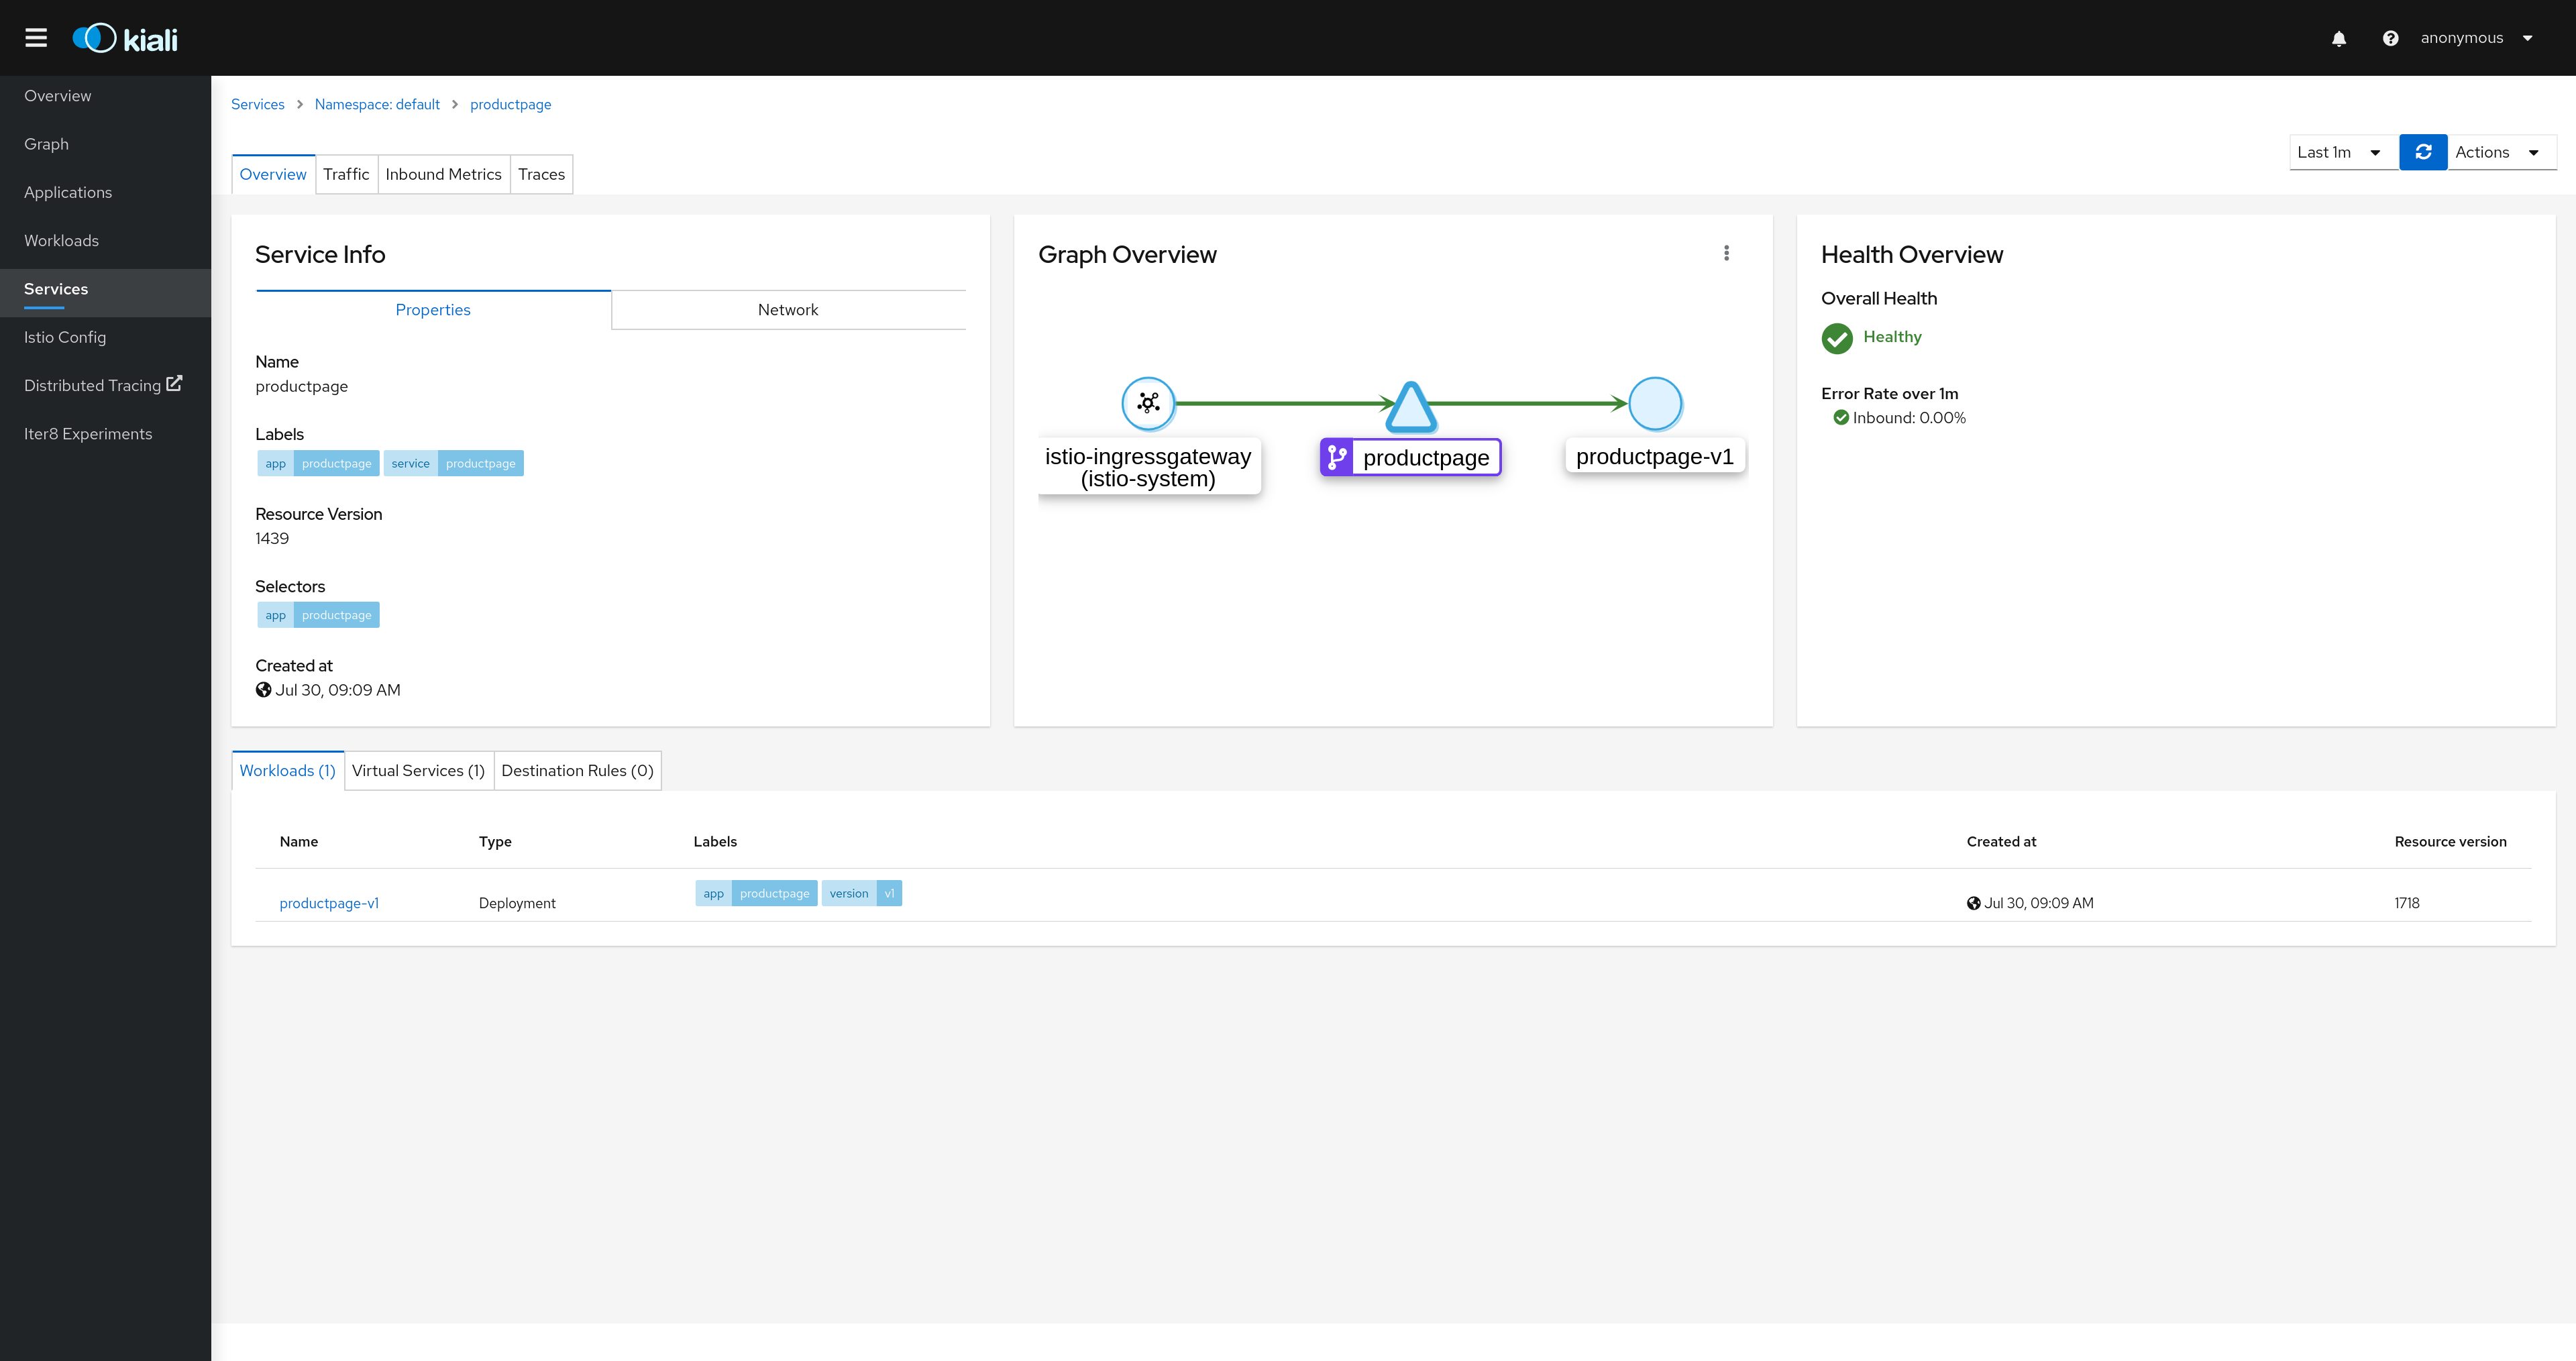
Detail: Overview
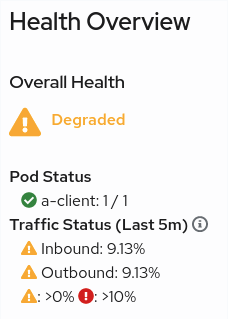
The overview tab provides detail information, a contextual graph and health overview for a specific Application, Workload or Service.
For each type of element, Kiali adds additional features.
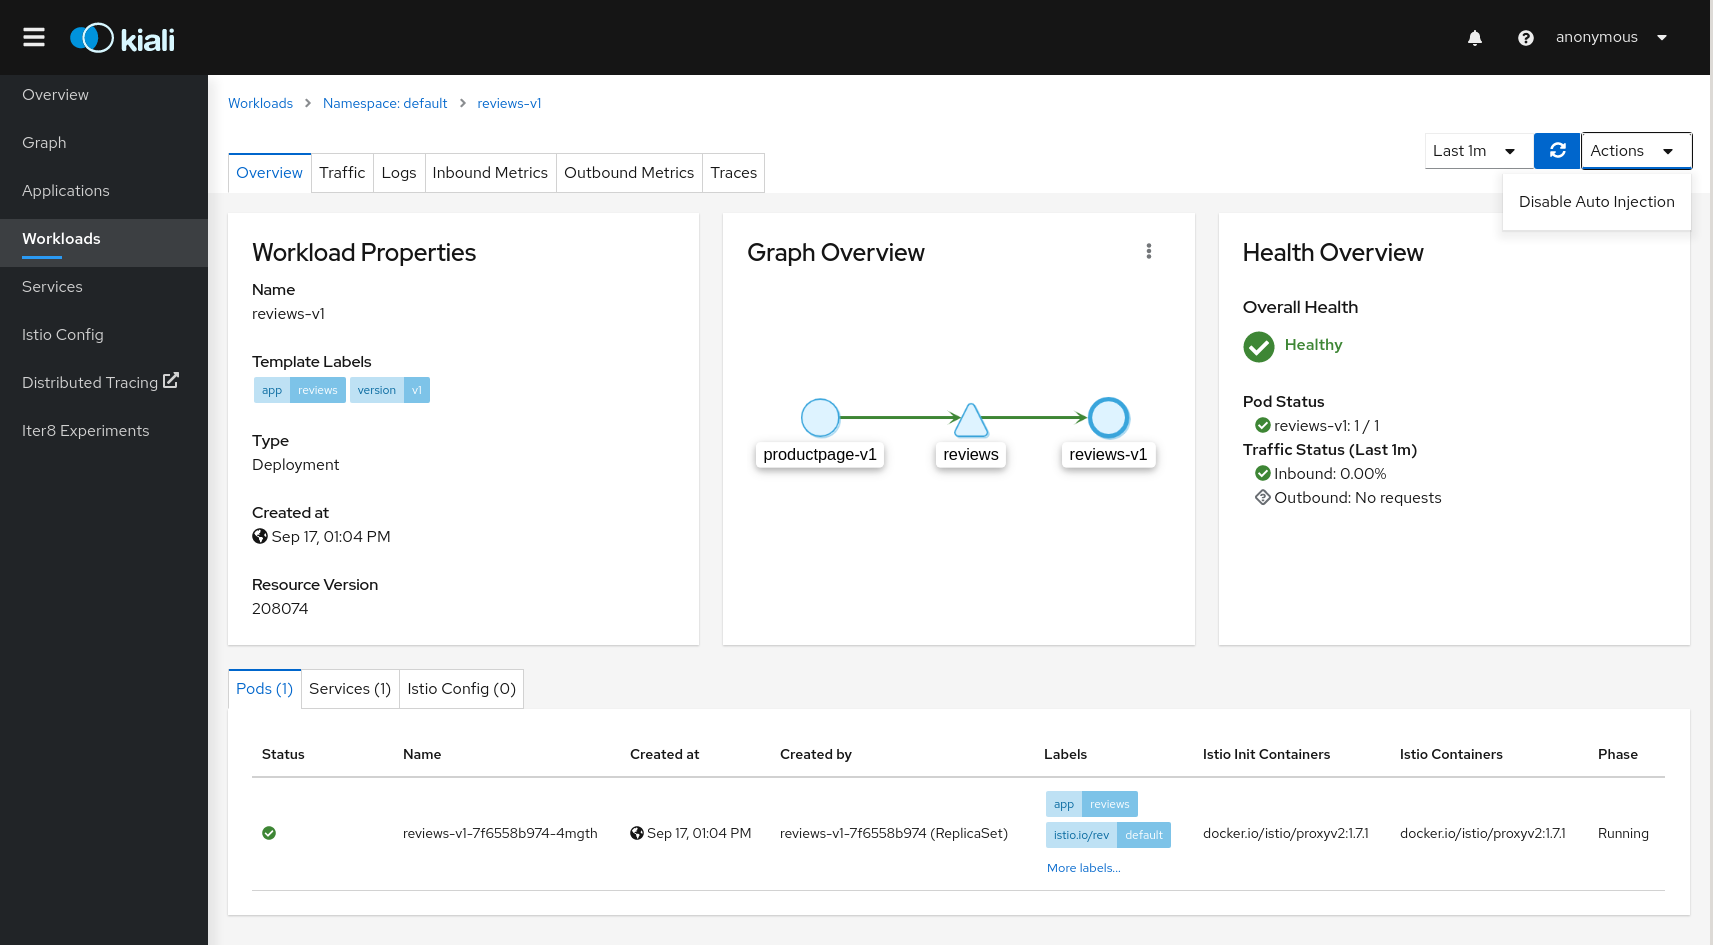
In the Workload Overview, Kiali performs several validations on workload configuration:
-
Are Istio sidecars deployed?
-
Are proper app and version labels assigned?
Workload detail shows the services for which the workload in handling requests, and the pods backing them.
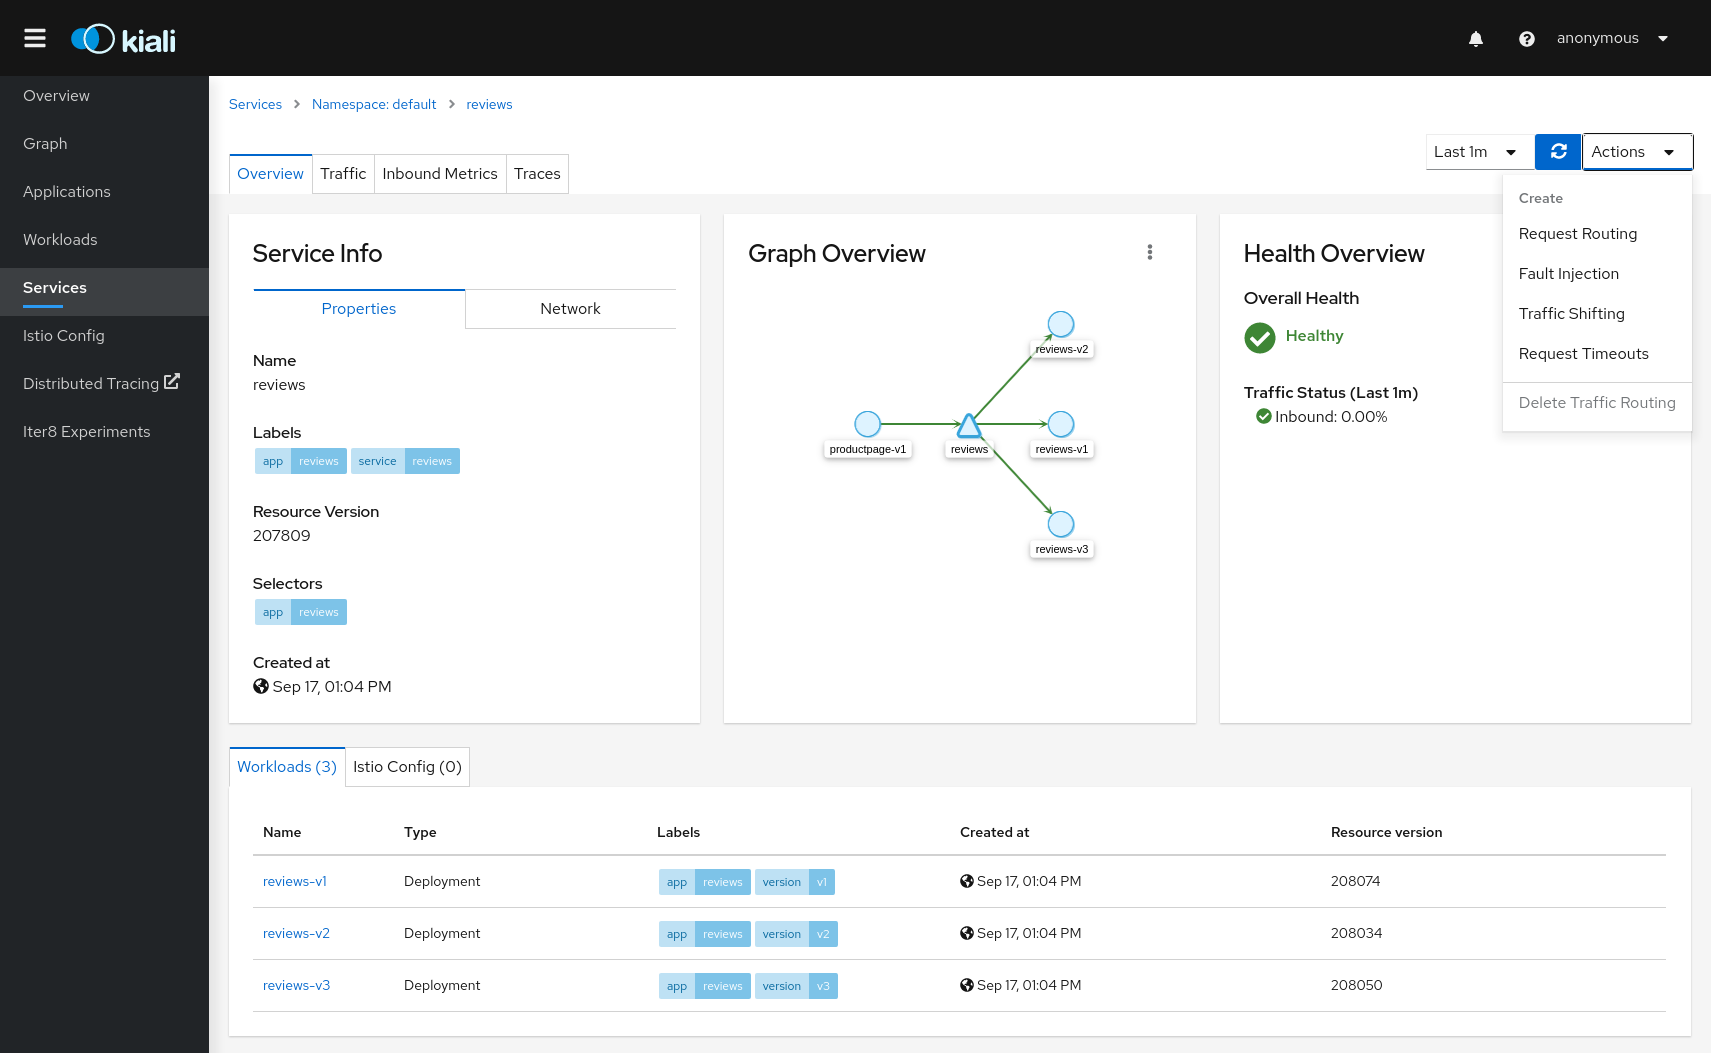
The Service Overview shows the workloads running the service. It also shows the Istio traffic routing configuration, VirtualServices and DestinationRules associated with the service.
Kiali provides access to YAML definitions and allows modification and deletion access for authorized users. It provides wizards to assist in common configurations and performs additional validation on VirtualServices to detect misconfigured routes.
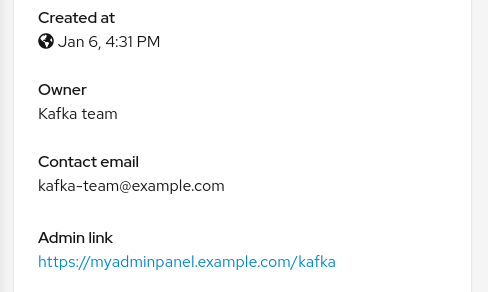
Both Workload and Service detail can be customized to some extent, by adding additional details supplied as annotations. This is done through the additional_display_details field in the Kiali CR or ConfigMap.
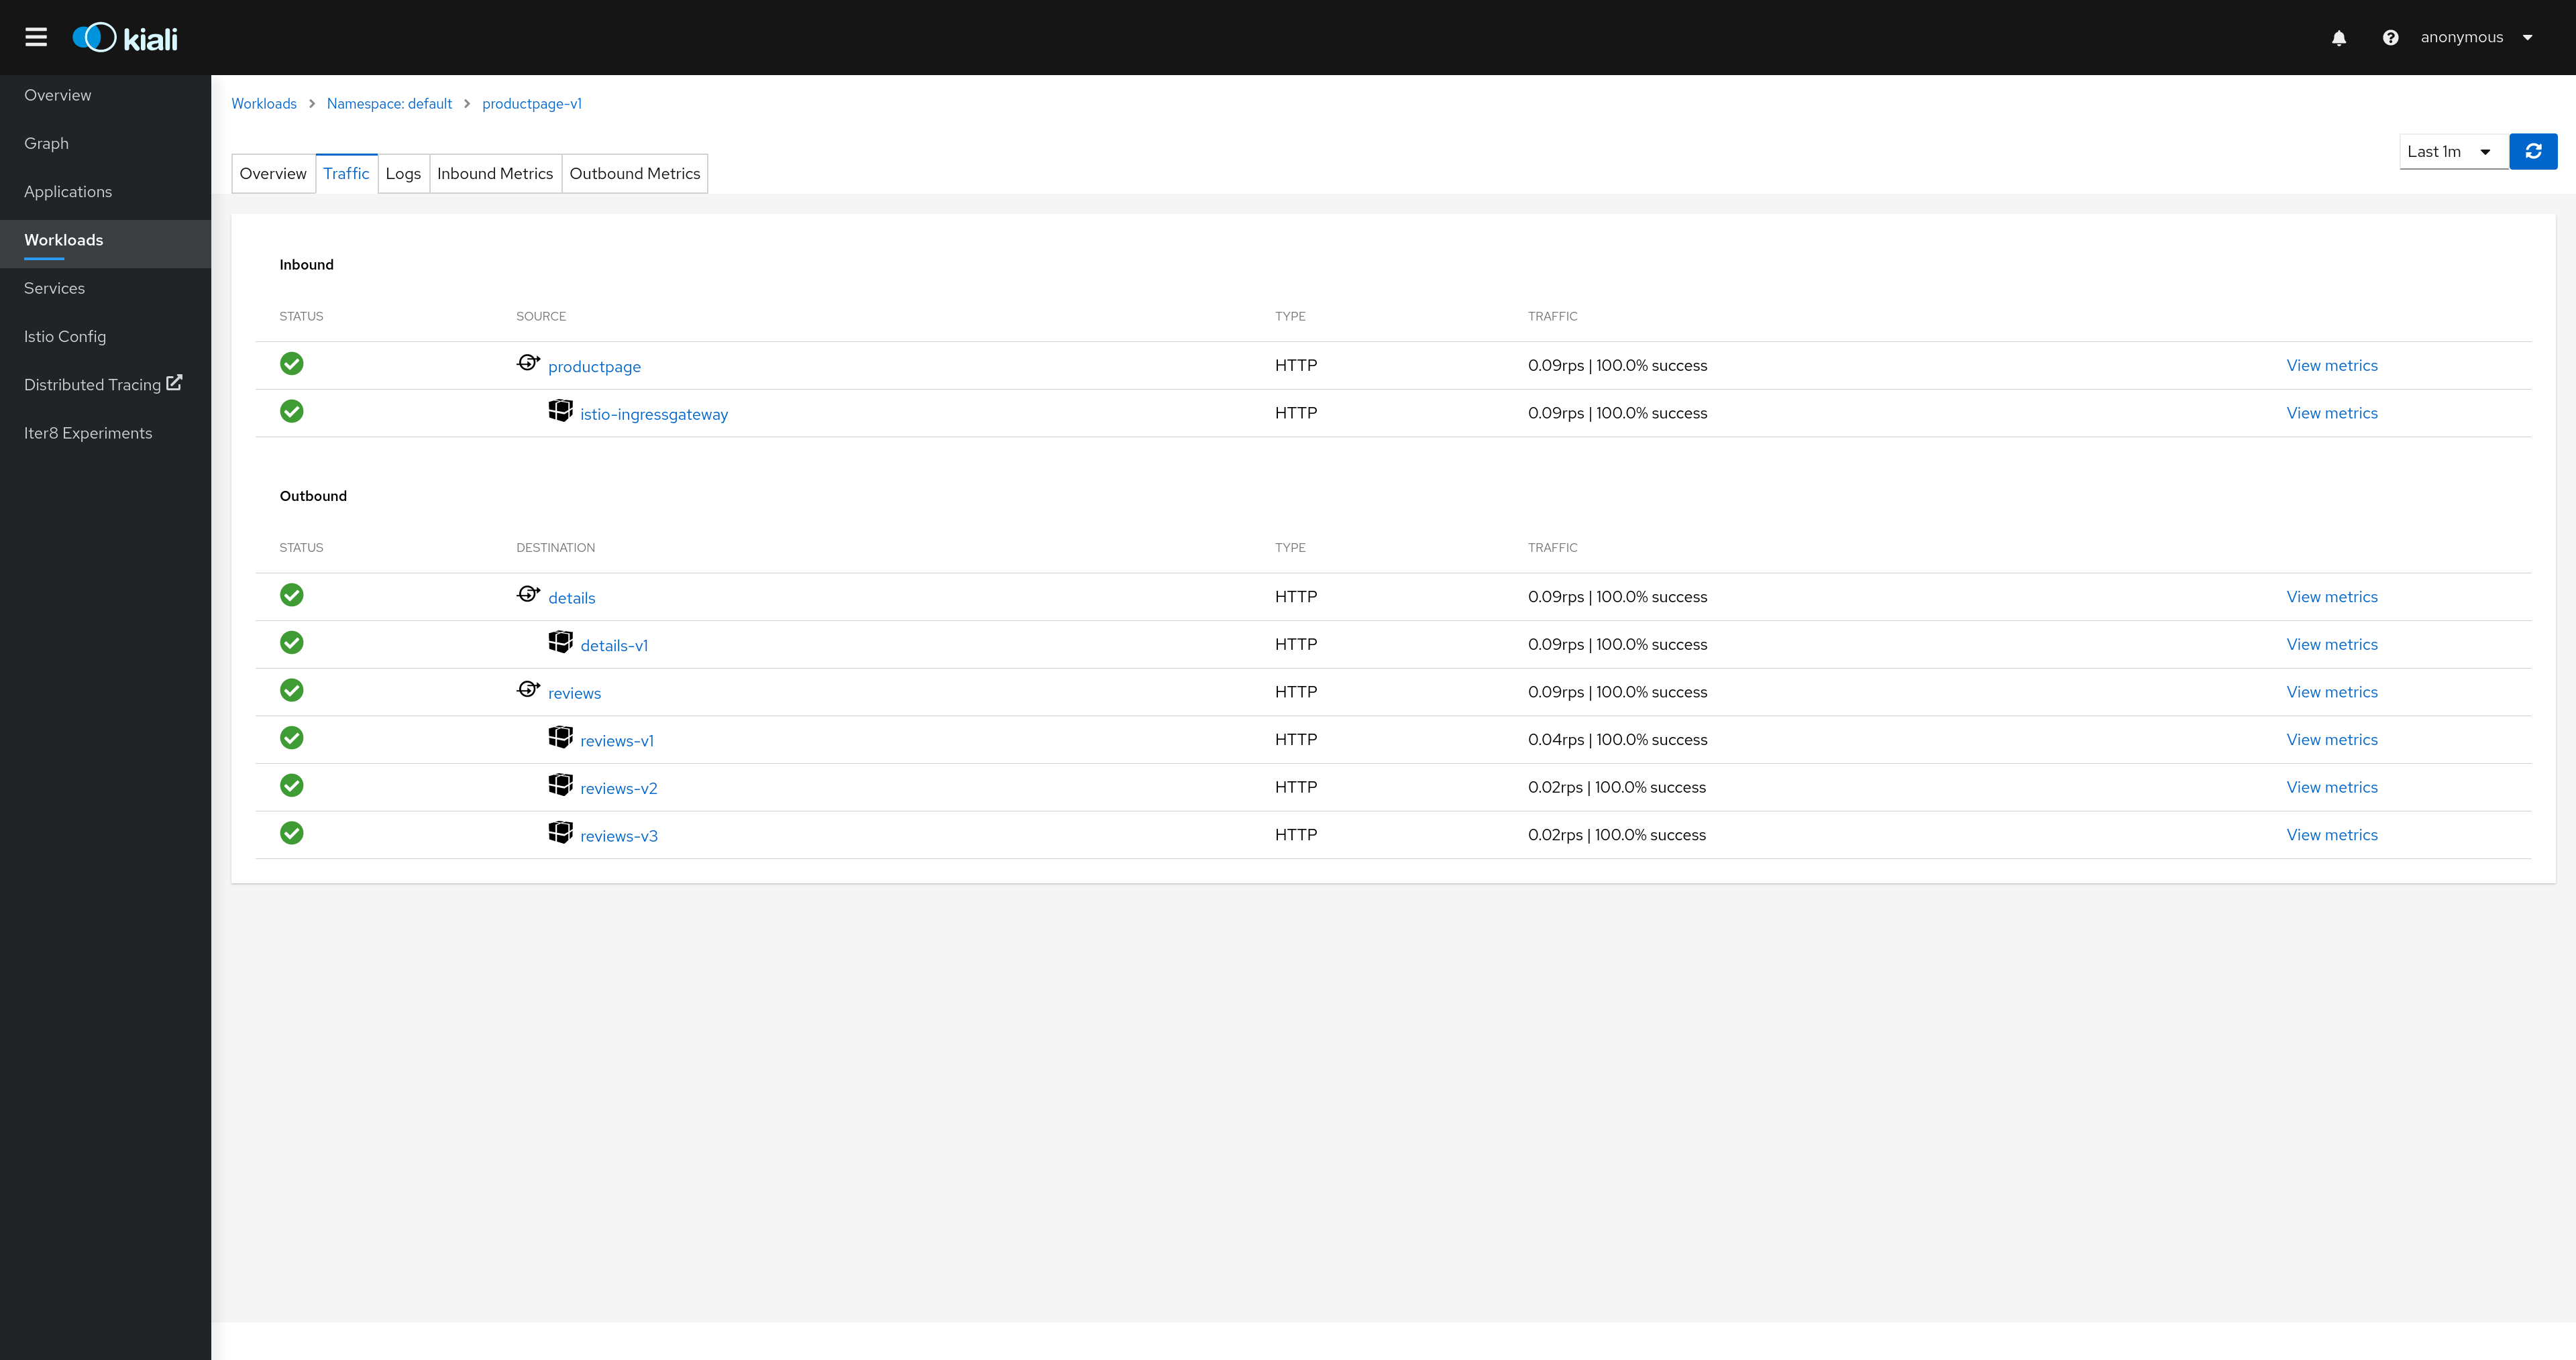
Detail: Traffic
The traffic tab collects all connections from and to a specific Application, Workload and/or Service.
It groups them in Inbound and Outbound tables providing traffic details and links to specific detailed metrics.
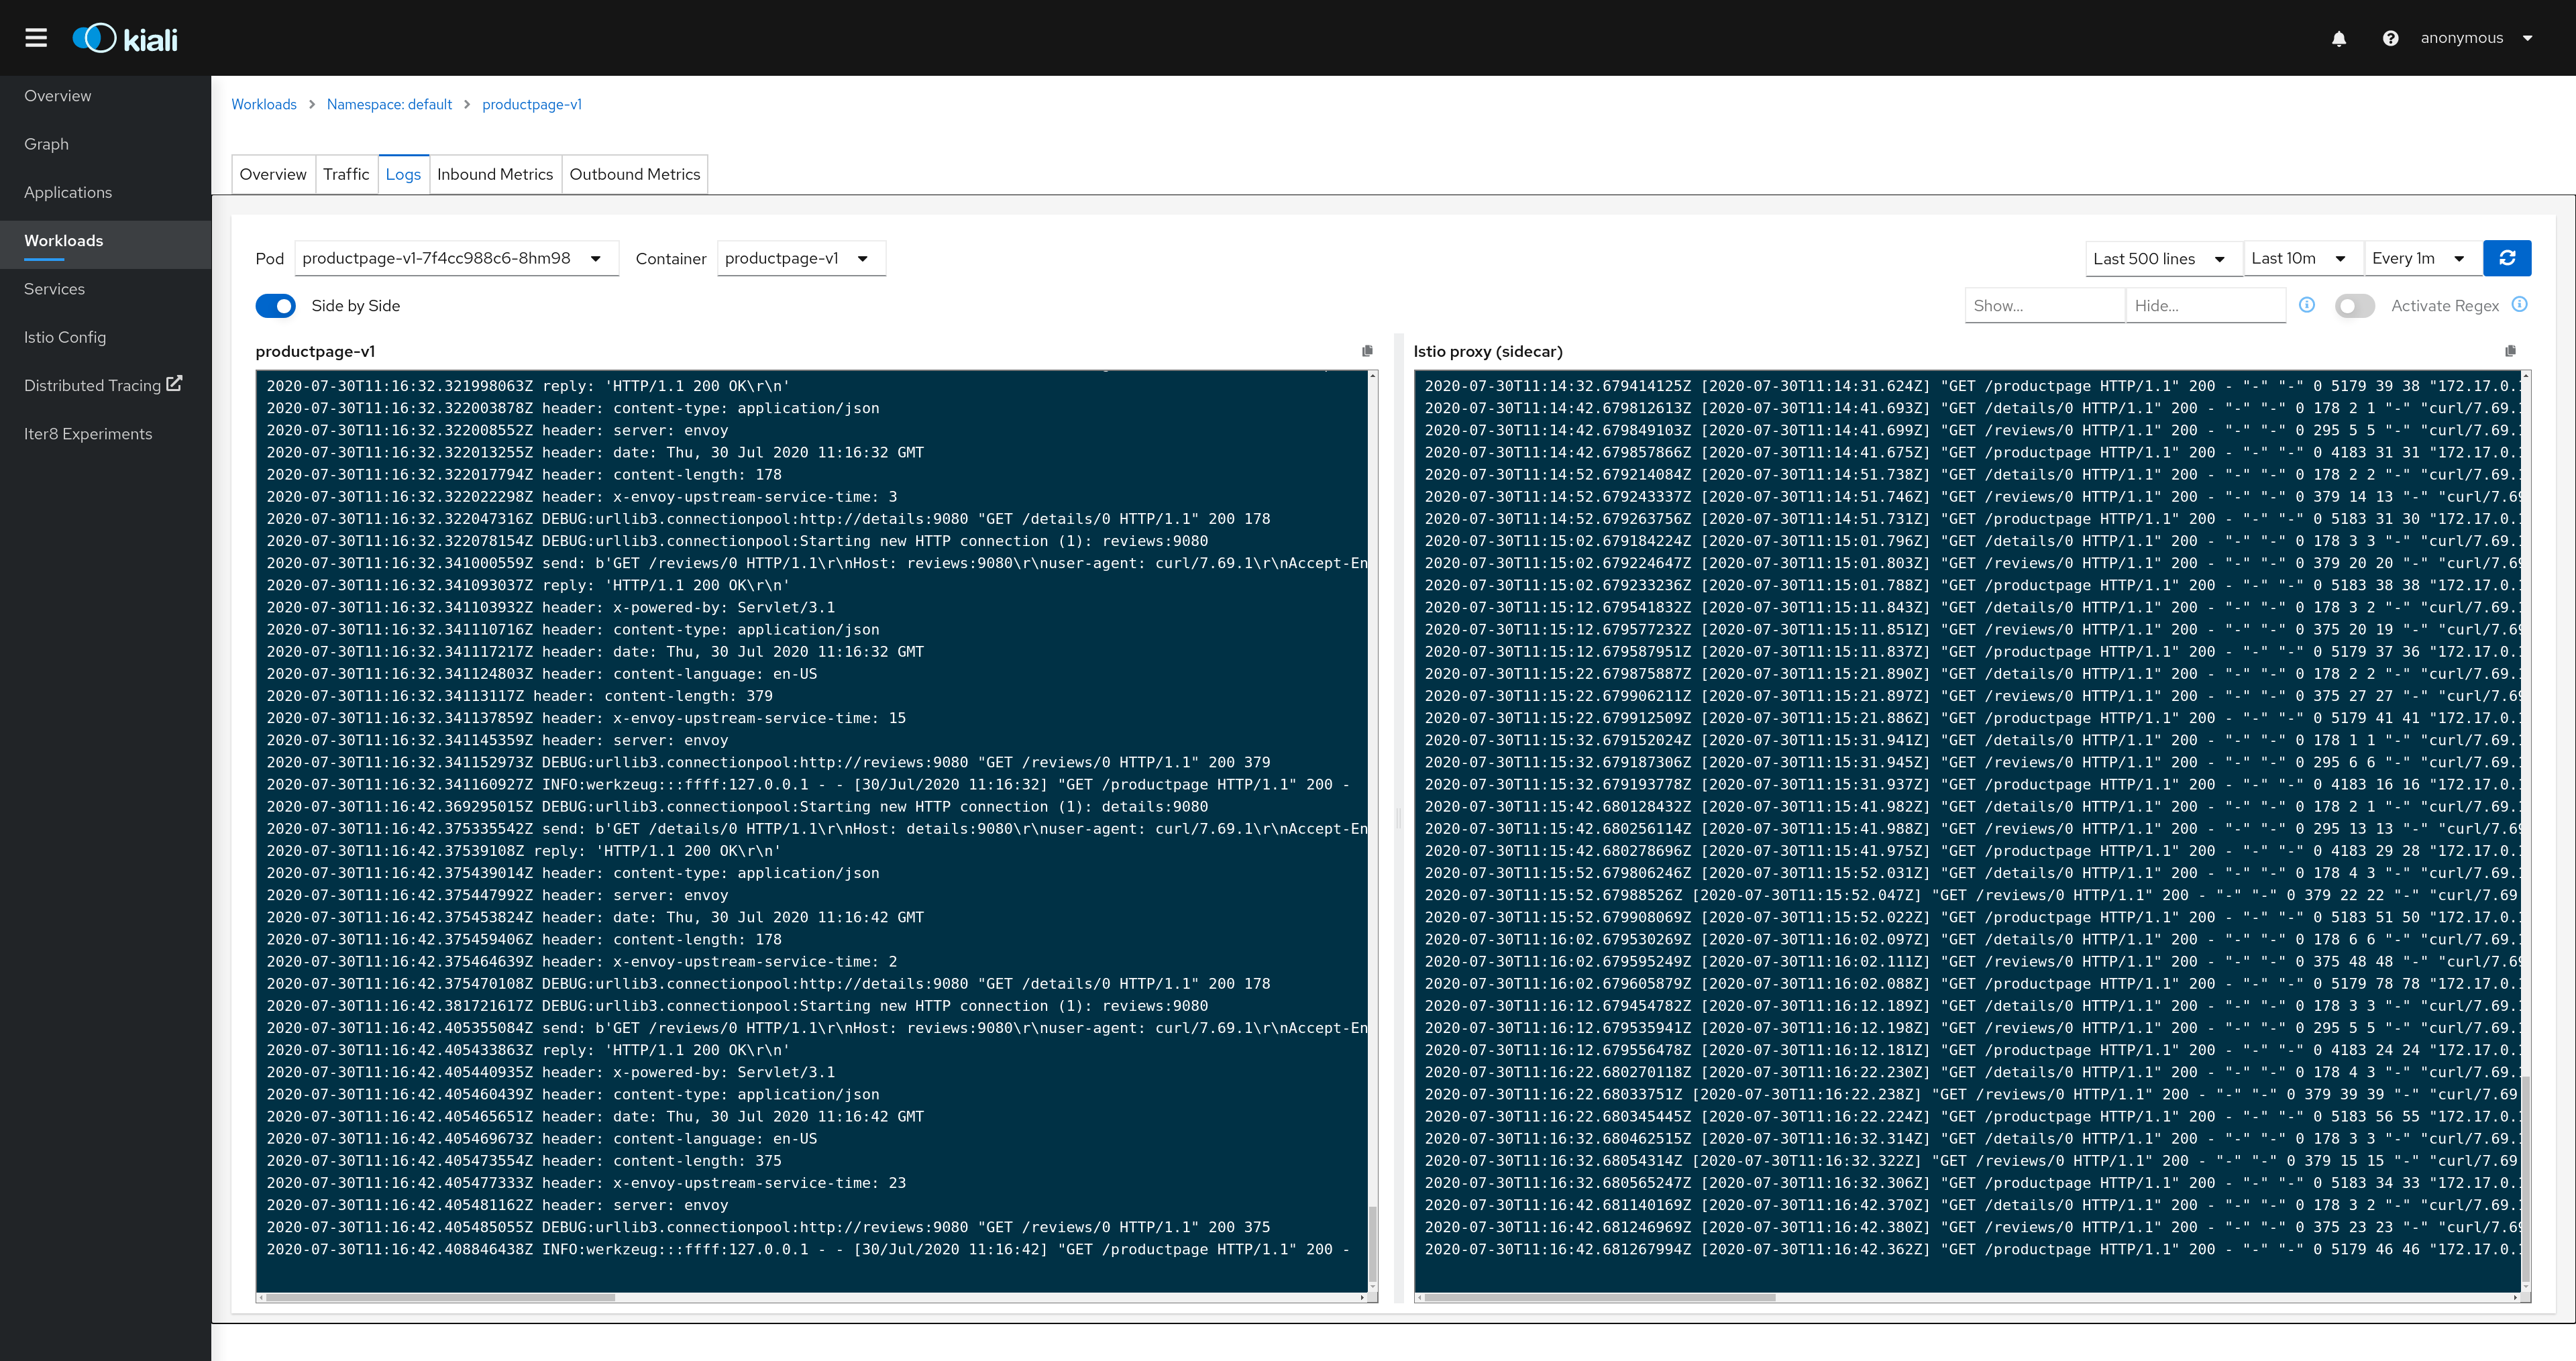
Detail: Logs
The Workload detail offer a special Logs tab. Kiali allows side-by-side viewing of both the application and the proxy logs of a selected pod.
The logs tab adds additional filtering capabilities to show or hide specific lines.
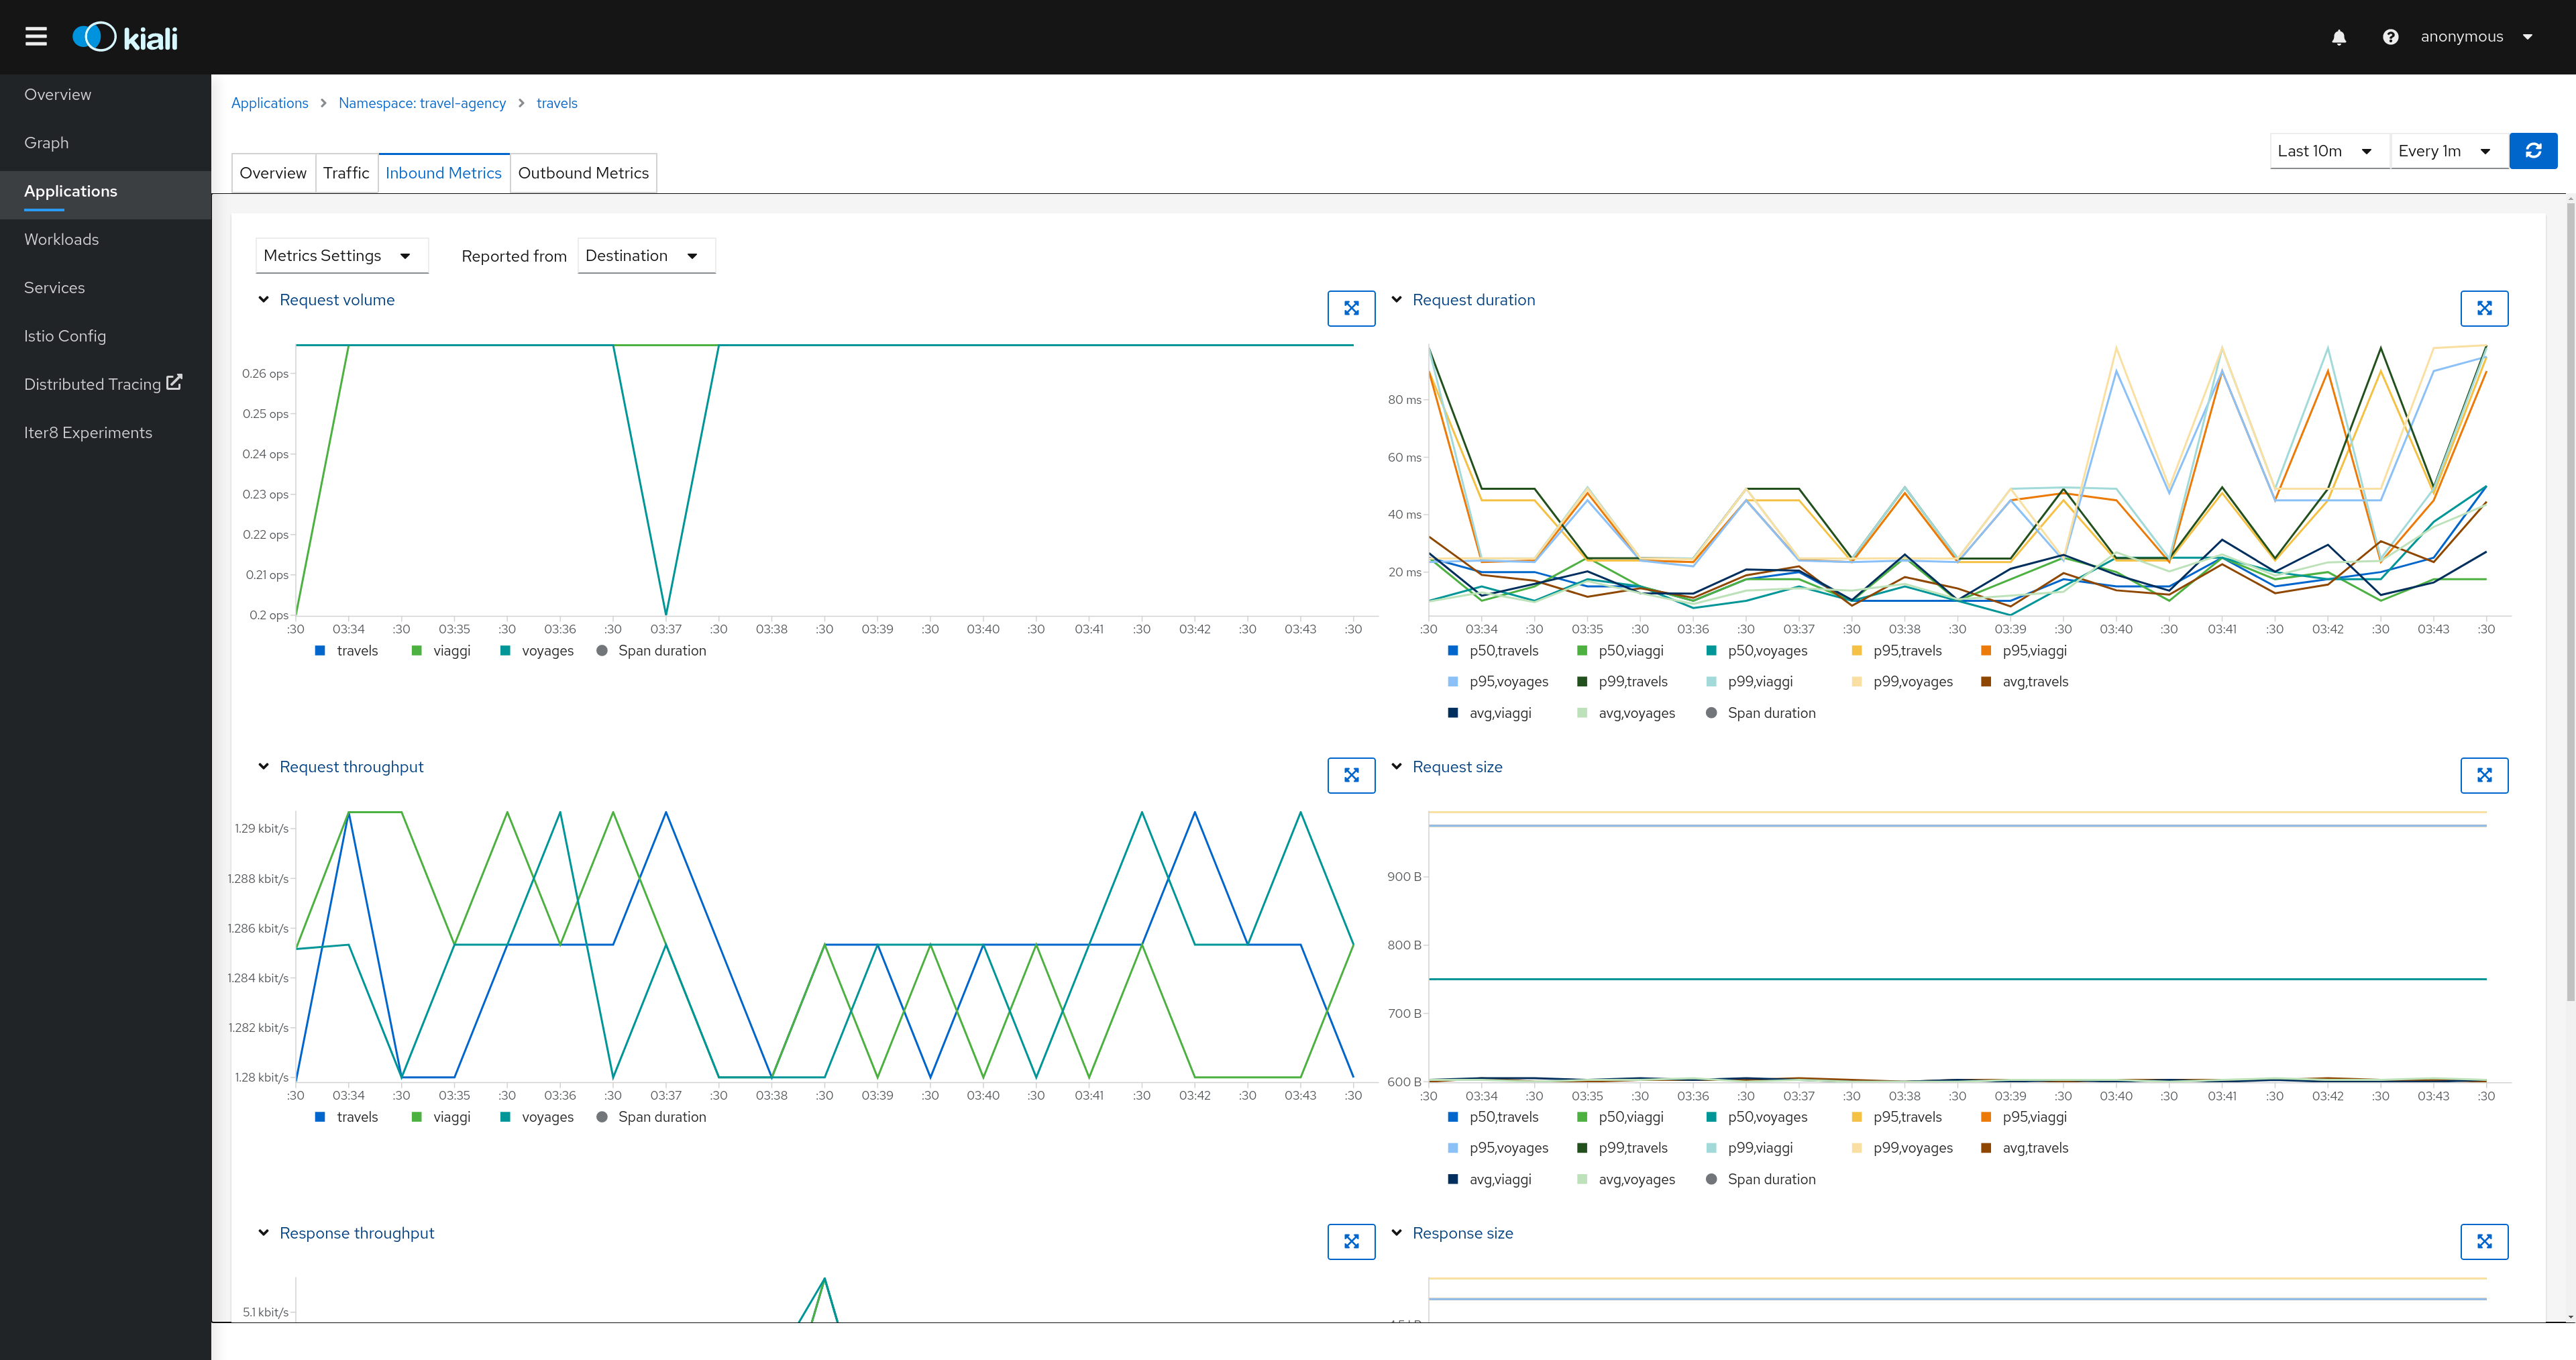
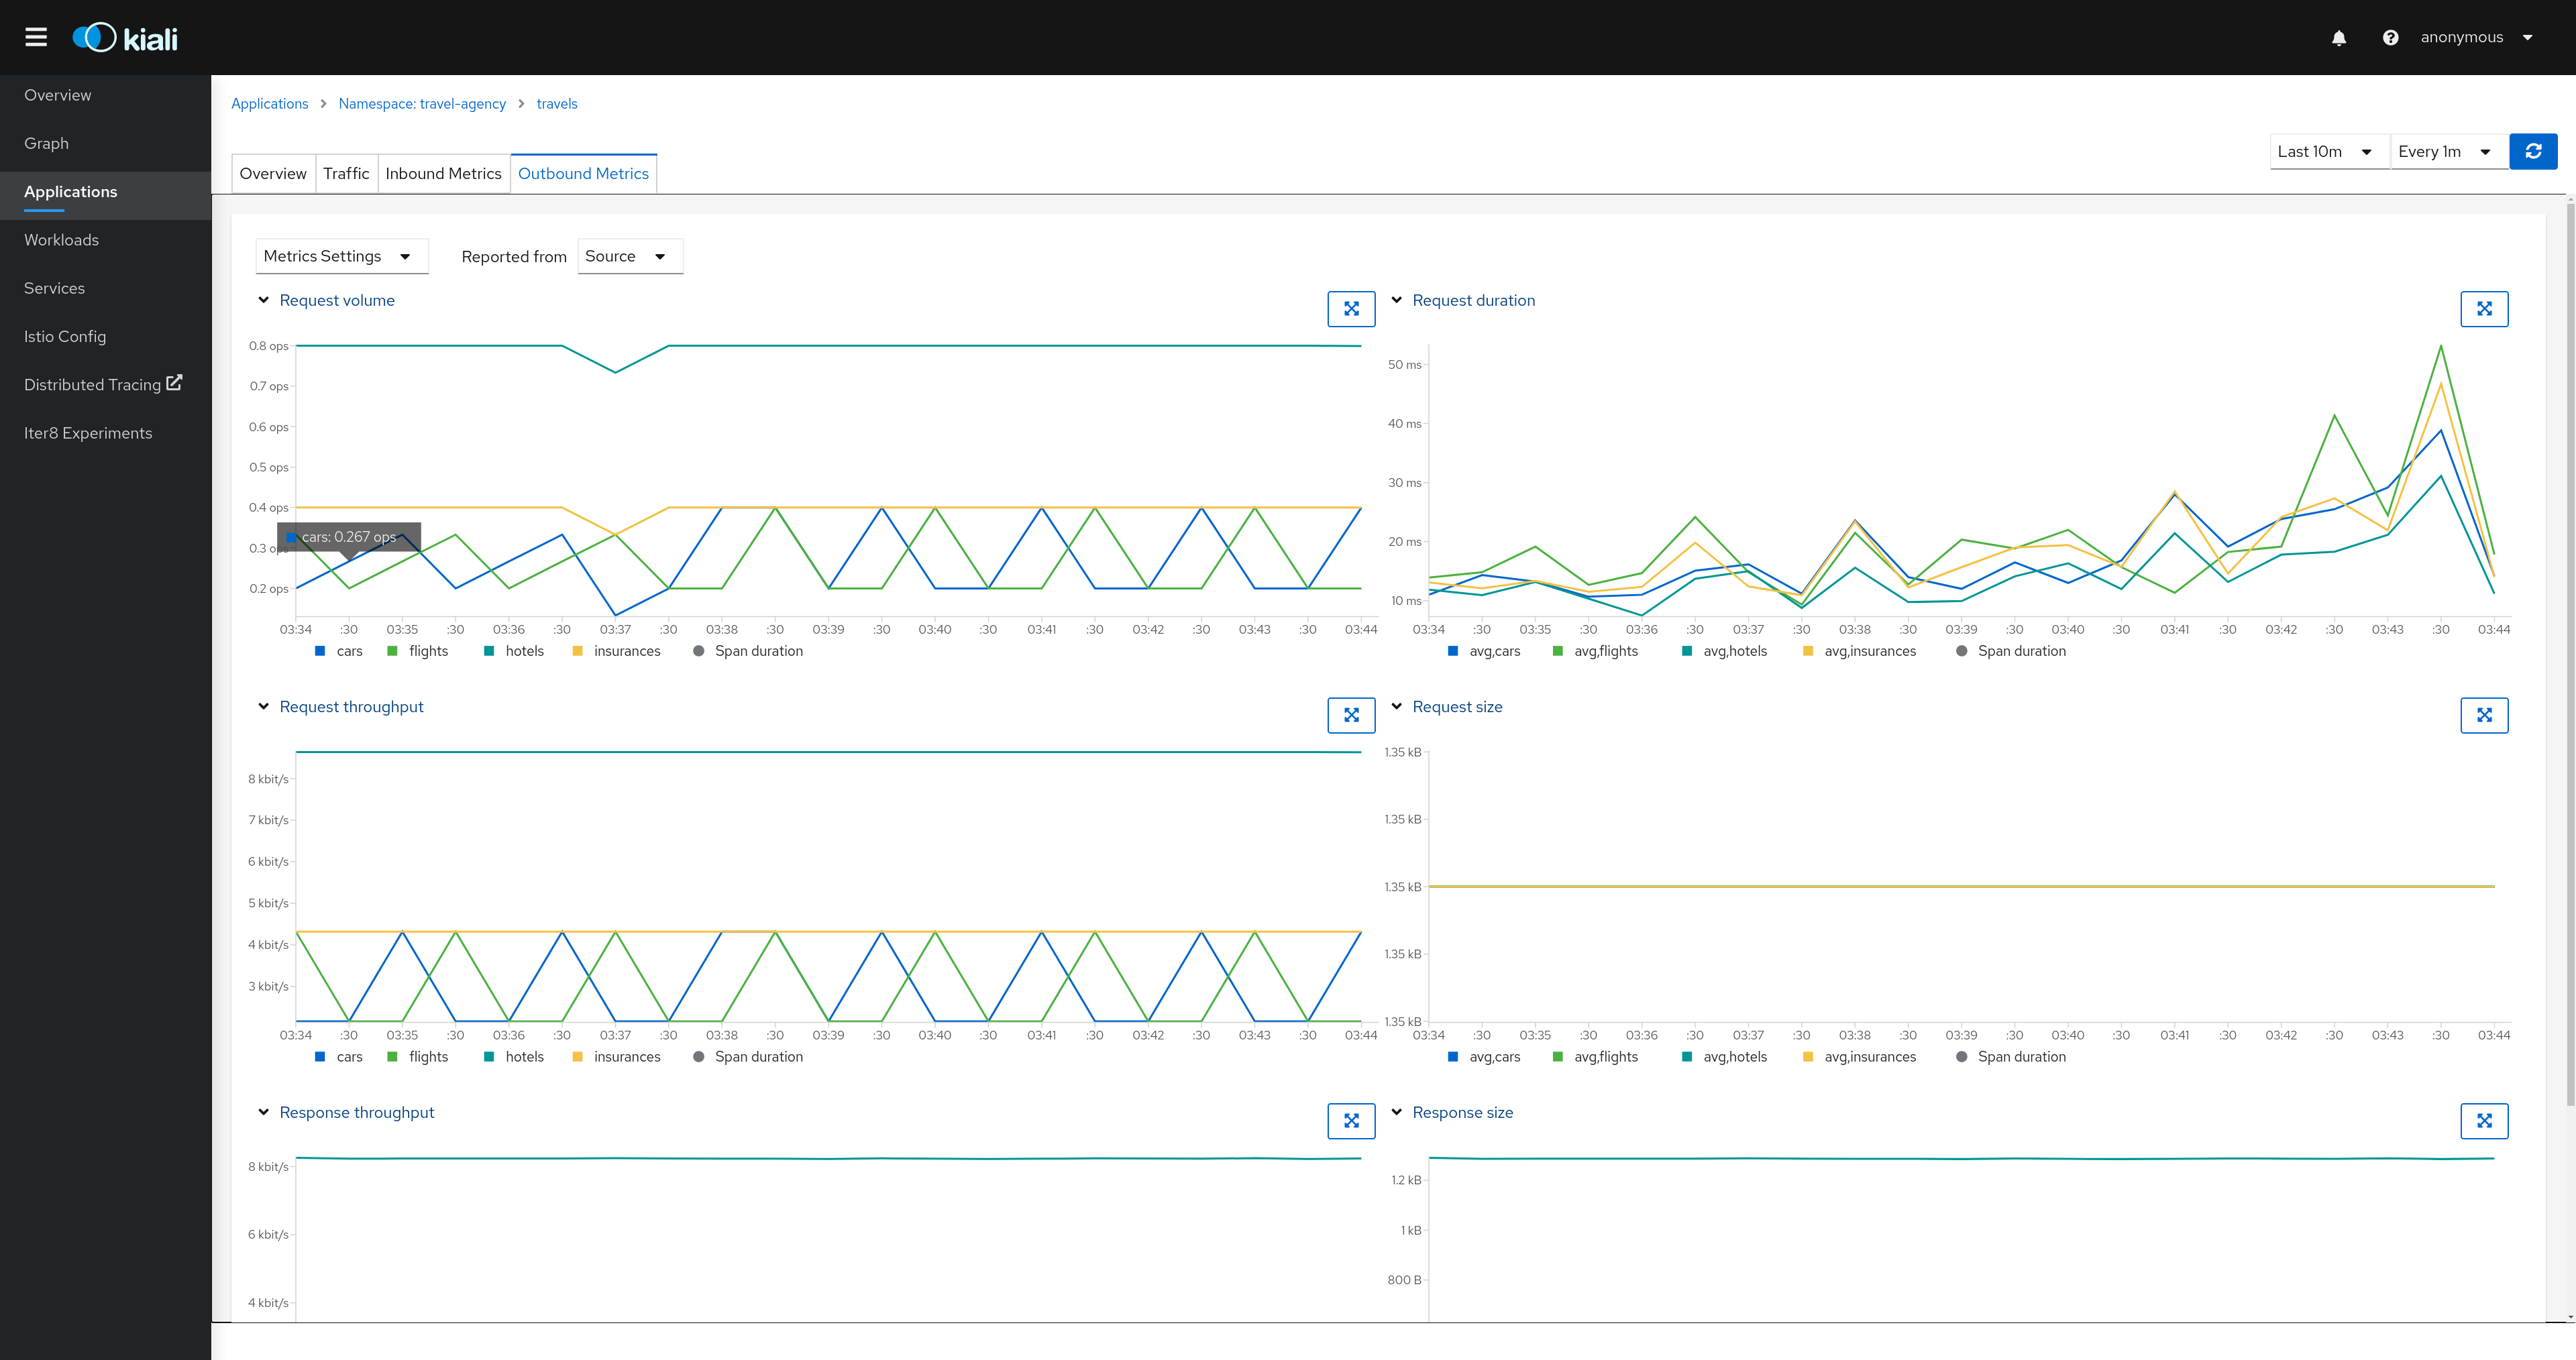
Detail: Metrics
Each detail view provides predefined metric dashboards. The metric dashboards provided are tailored to the relevant application, workload or service level.
Application and workload detail views show request and response metrics such as volume, duration, size, or tcp traffic. The traffic can also be viewed for either inbound or outbound traffic.
The service detail view shows request and response metrics for inbound traffic.
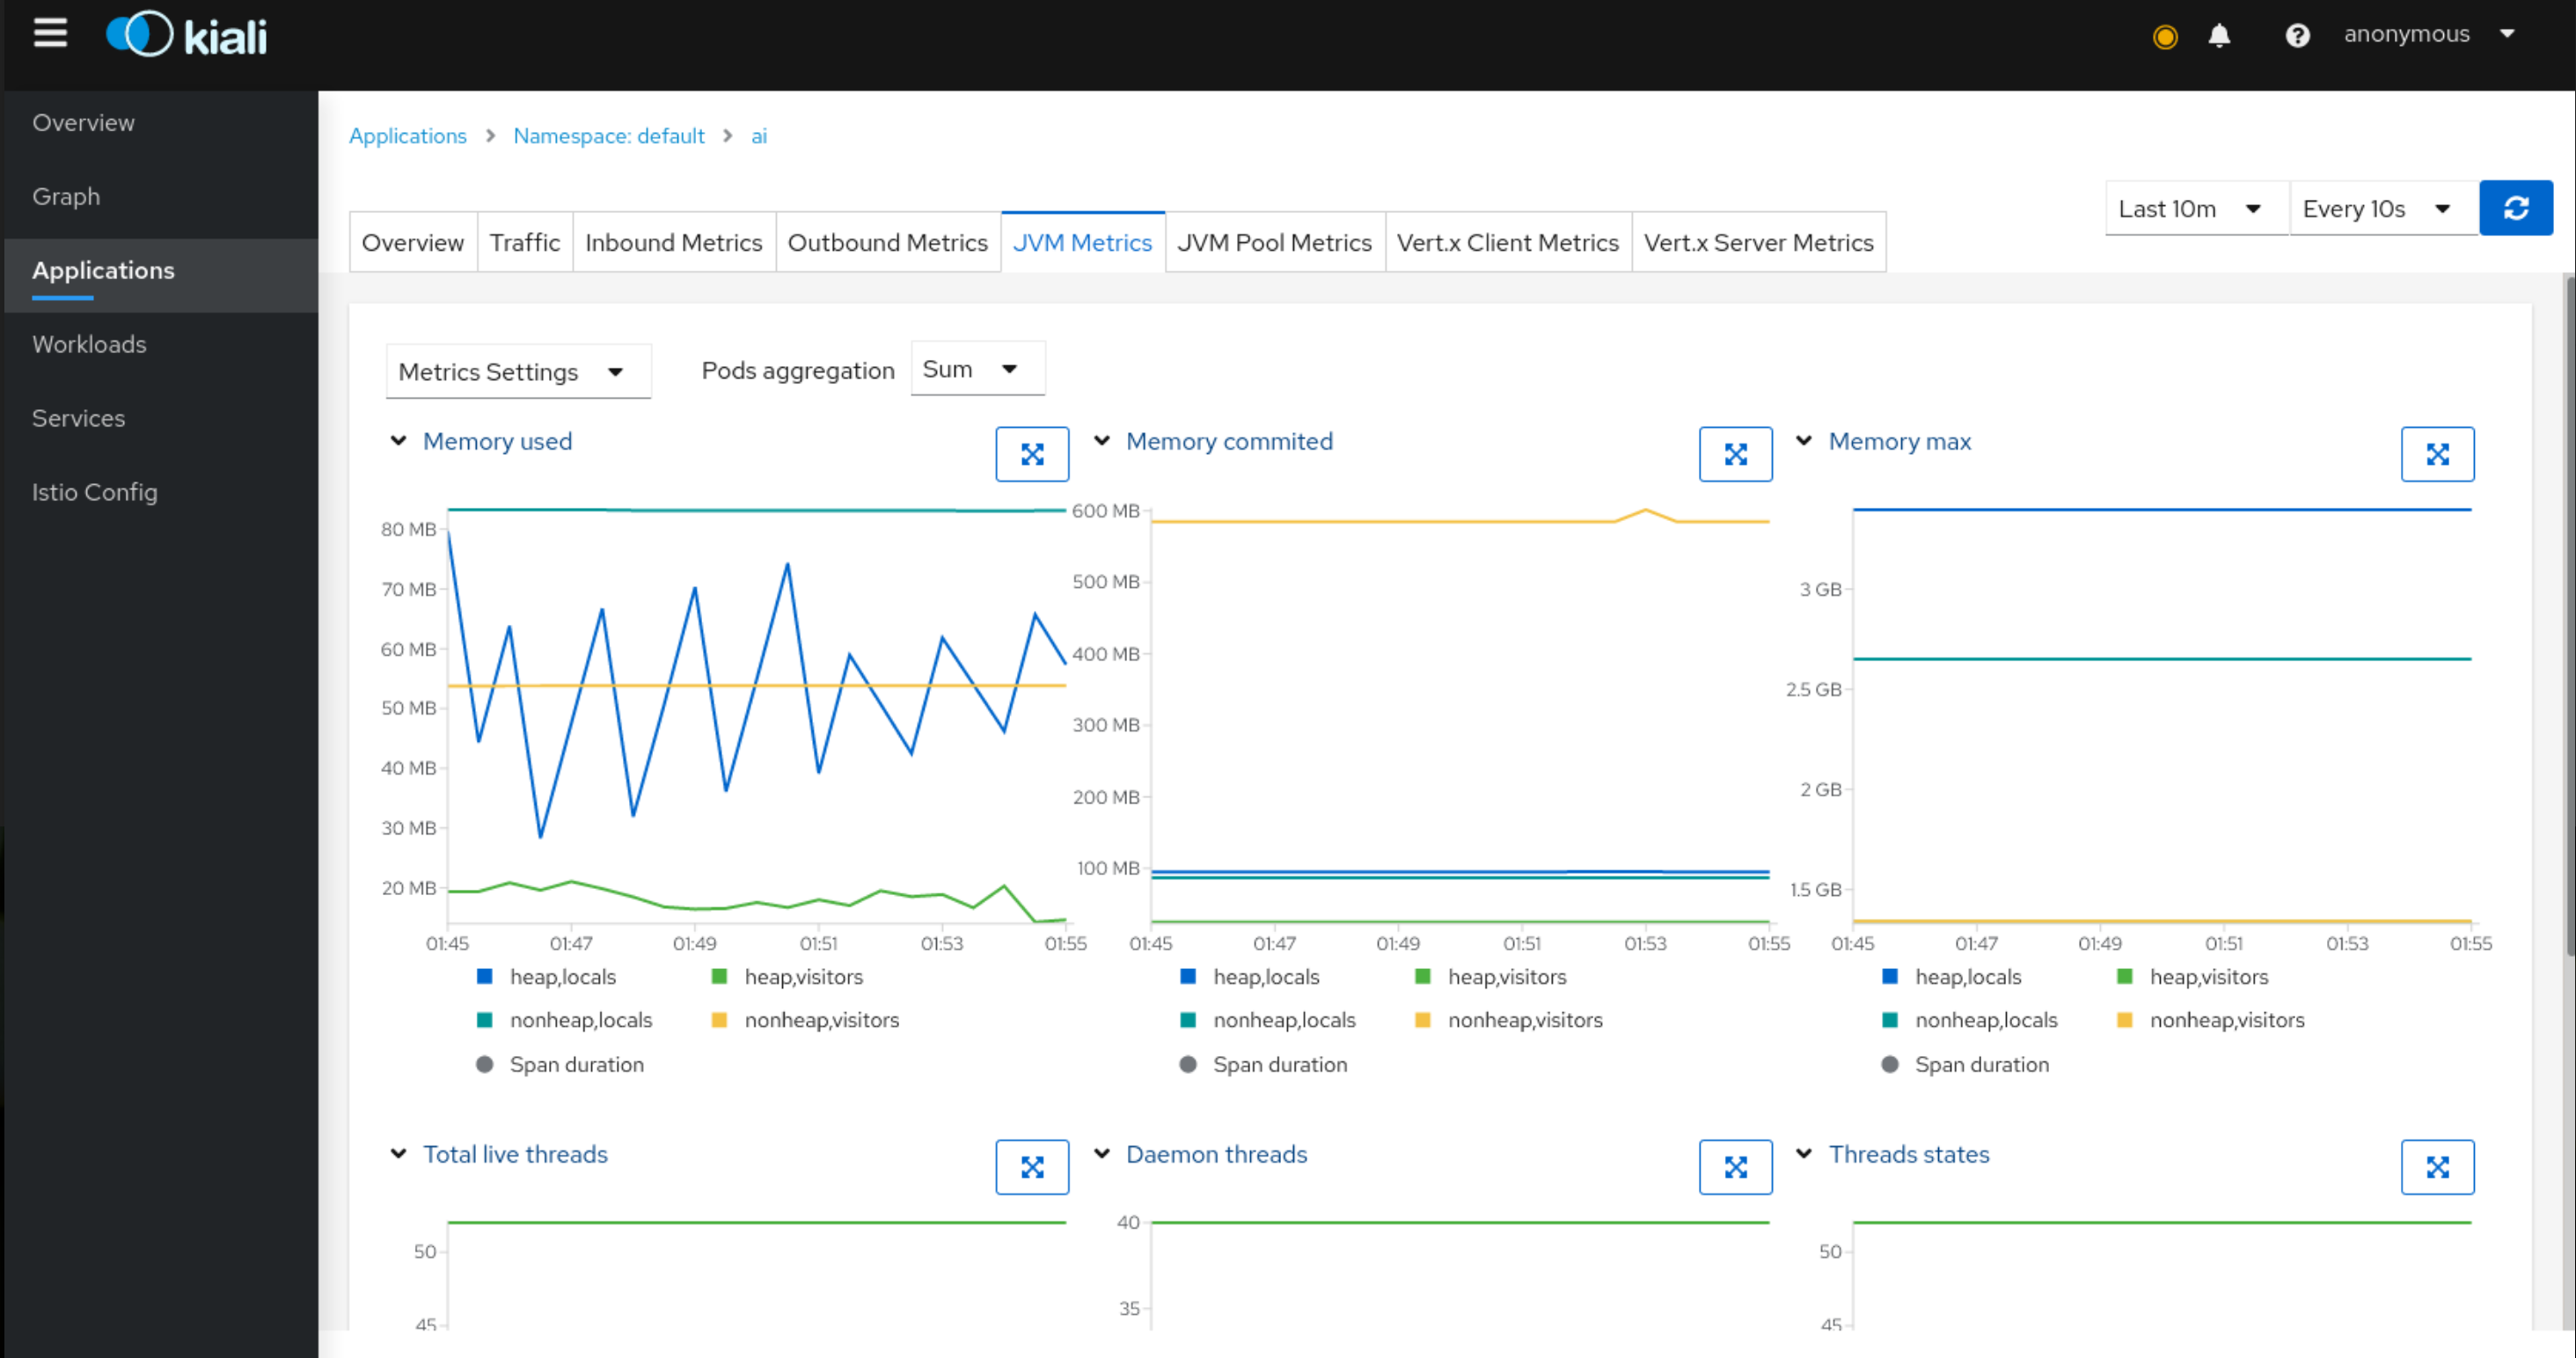
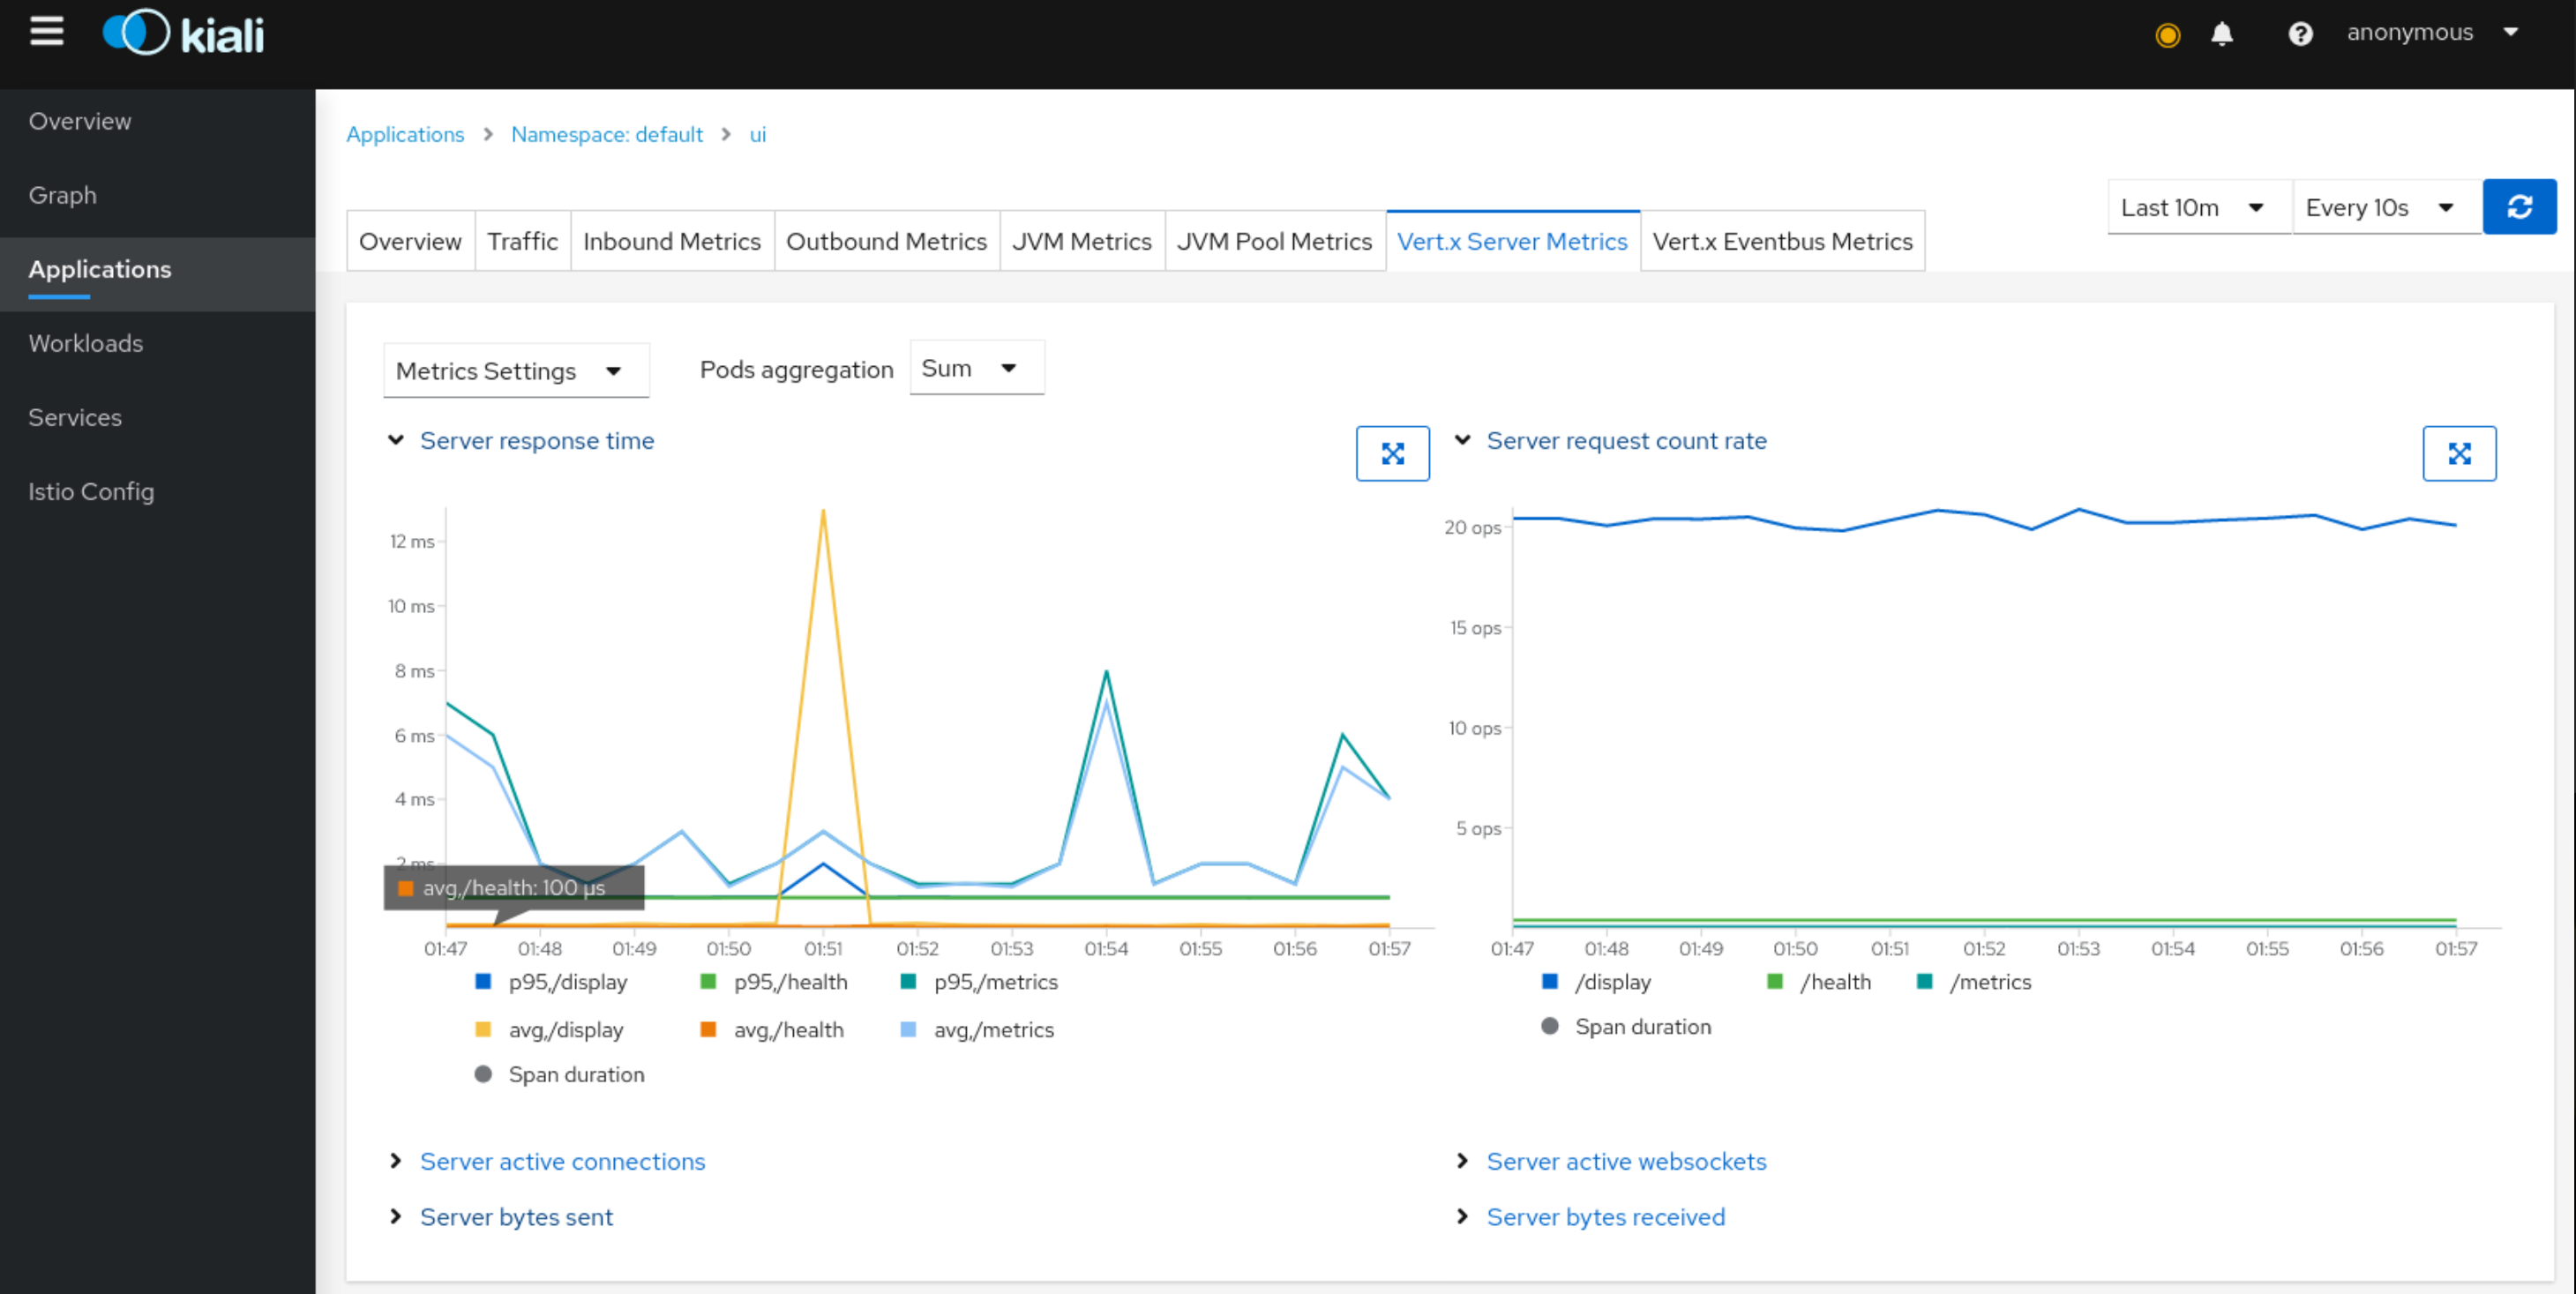
Detail: Custom Dashboards
Kiali comes with default dashboards for several runtimes, including Go, Node.js, Spring Boot, Thorntail, and Vert.x.
These dashboards are simple Kubernetes resources, so you can use your favorite tool to create, modify or delete them. As they are defined as plain YAML or JSON files, so it’s easy to keep them in source control like Git, track their changes, and share them.
Check out the documentation page to learn more about it.
Detail: Traces
Kiali has now a Span duration legend item on Service Metrics tab, when enabled, correlates Span and Metrics on the same chart.

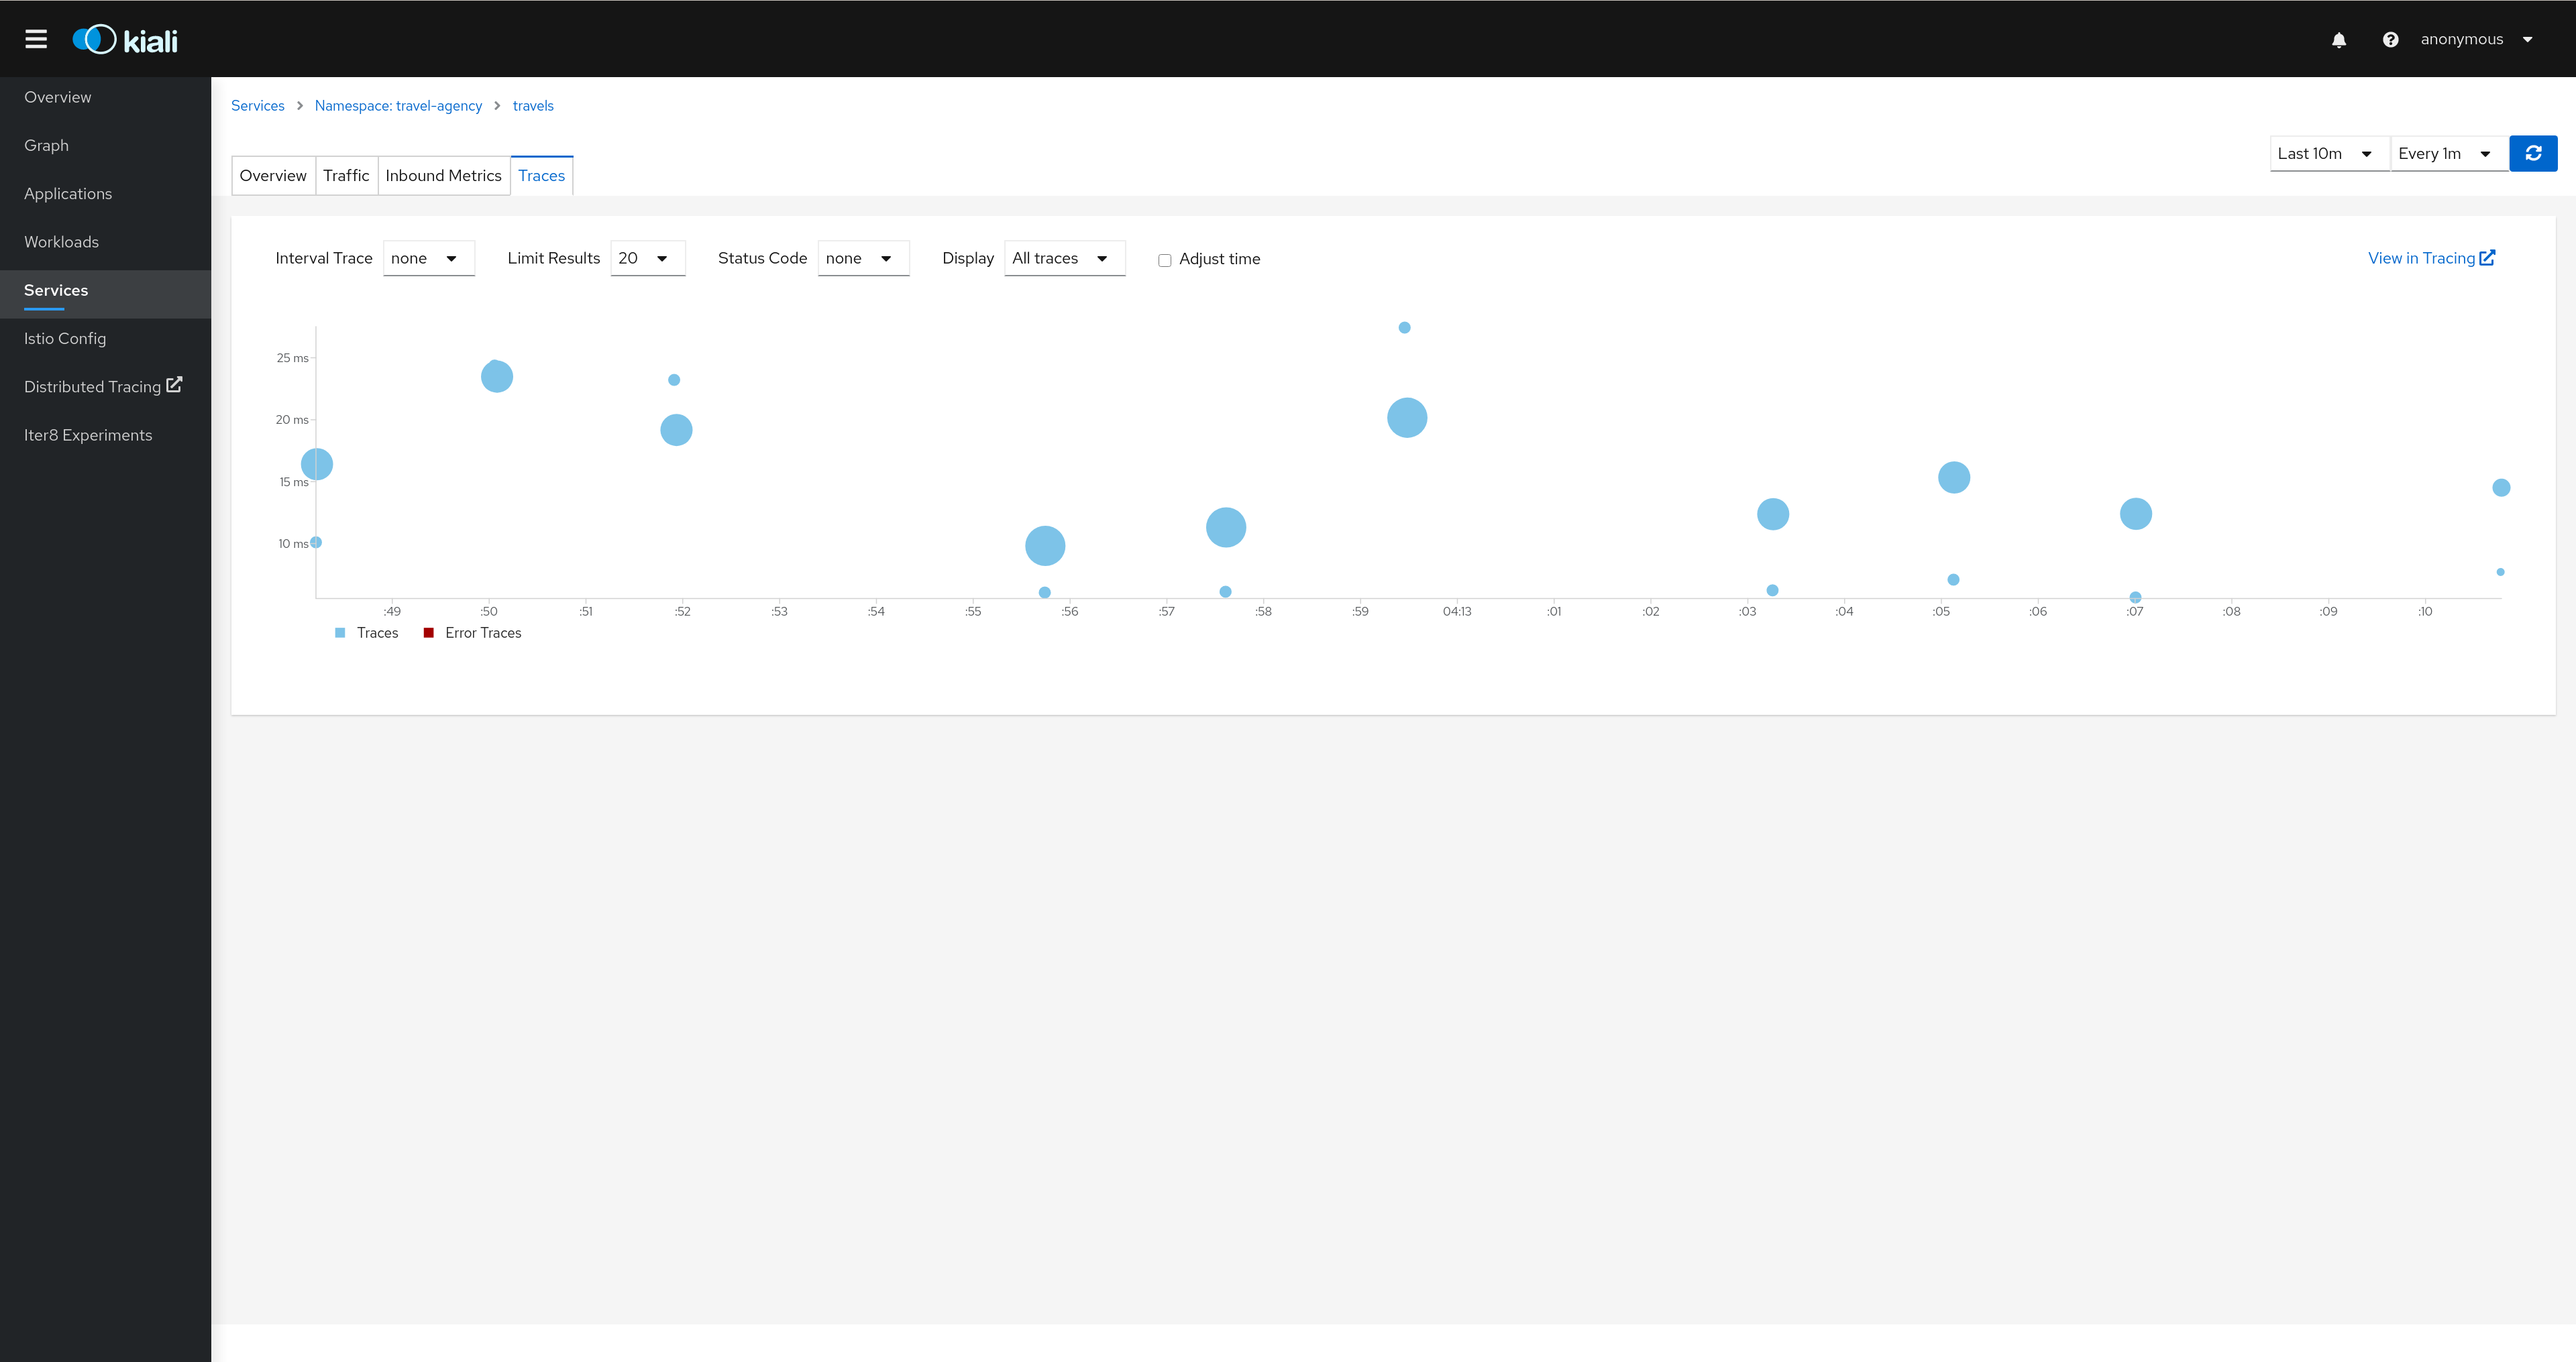
User can navigate to the traces tab to browse filtered traces for a given service in the time interval or to show details for a single trace.
The tracing toolbar offers some control over the data to fetch, to facilitate the user experience. In the tracing view, as shown in the image below, it’s possible to select the traces interval, results limit, status code, errors, adjust time (expand results on time), last Xm traffic (Traces from last minutes) and refresh interval.
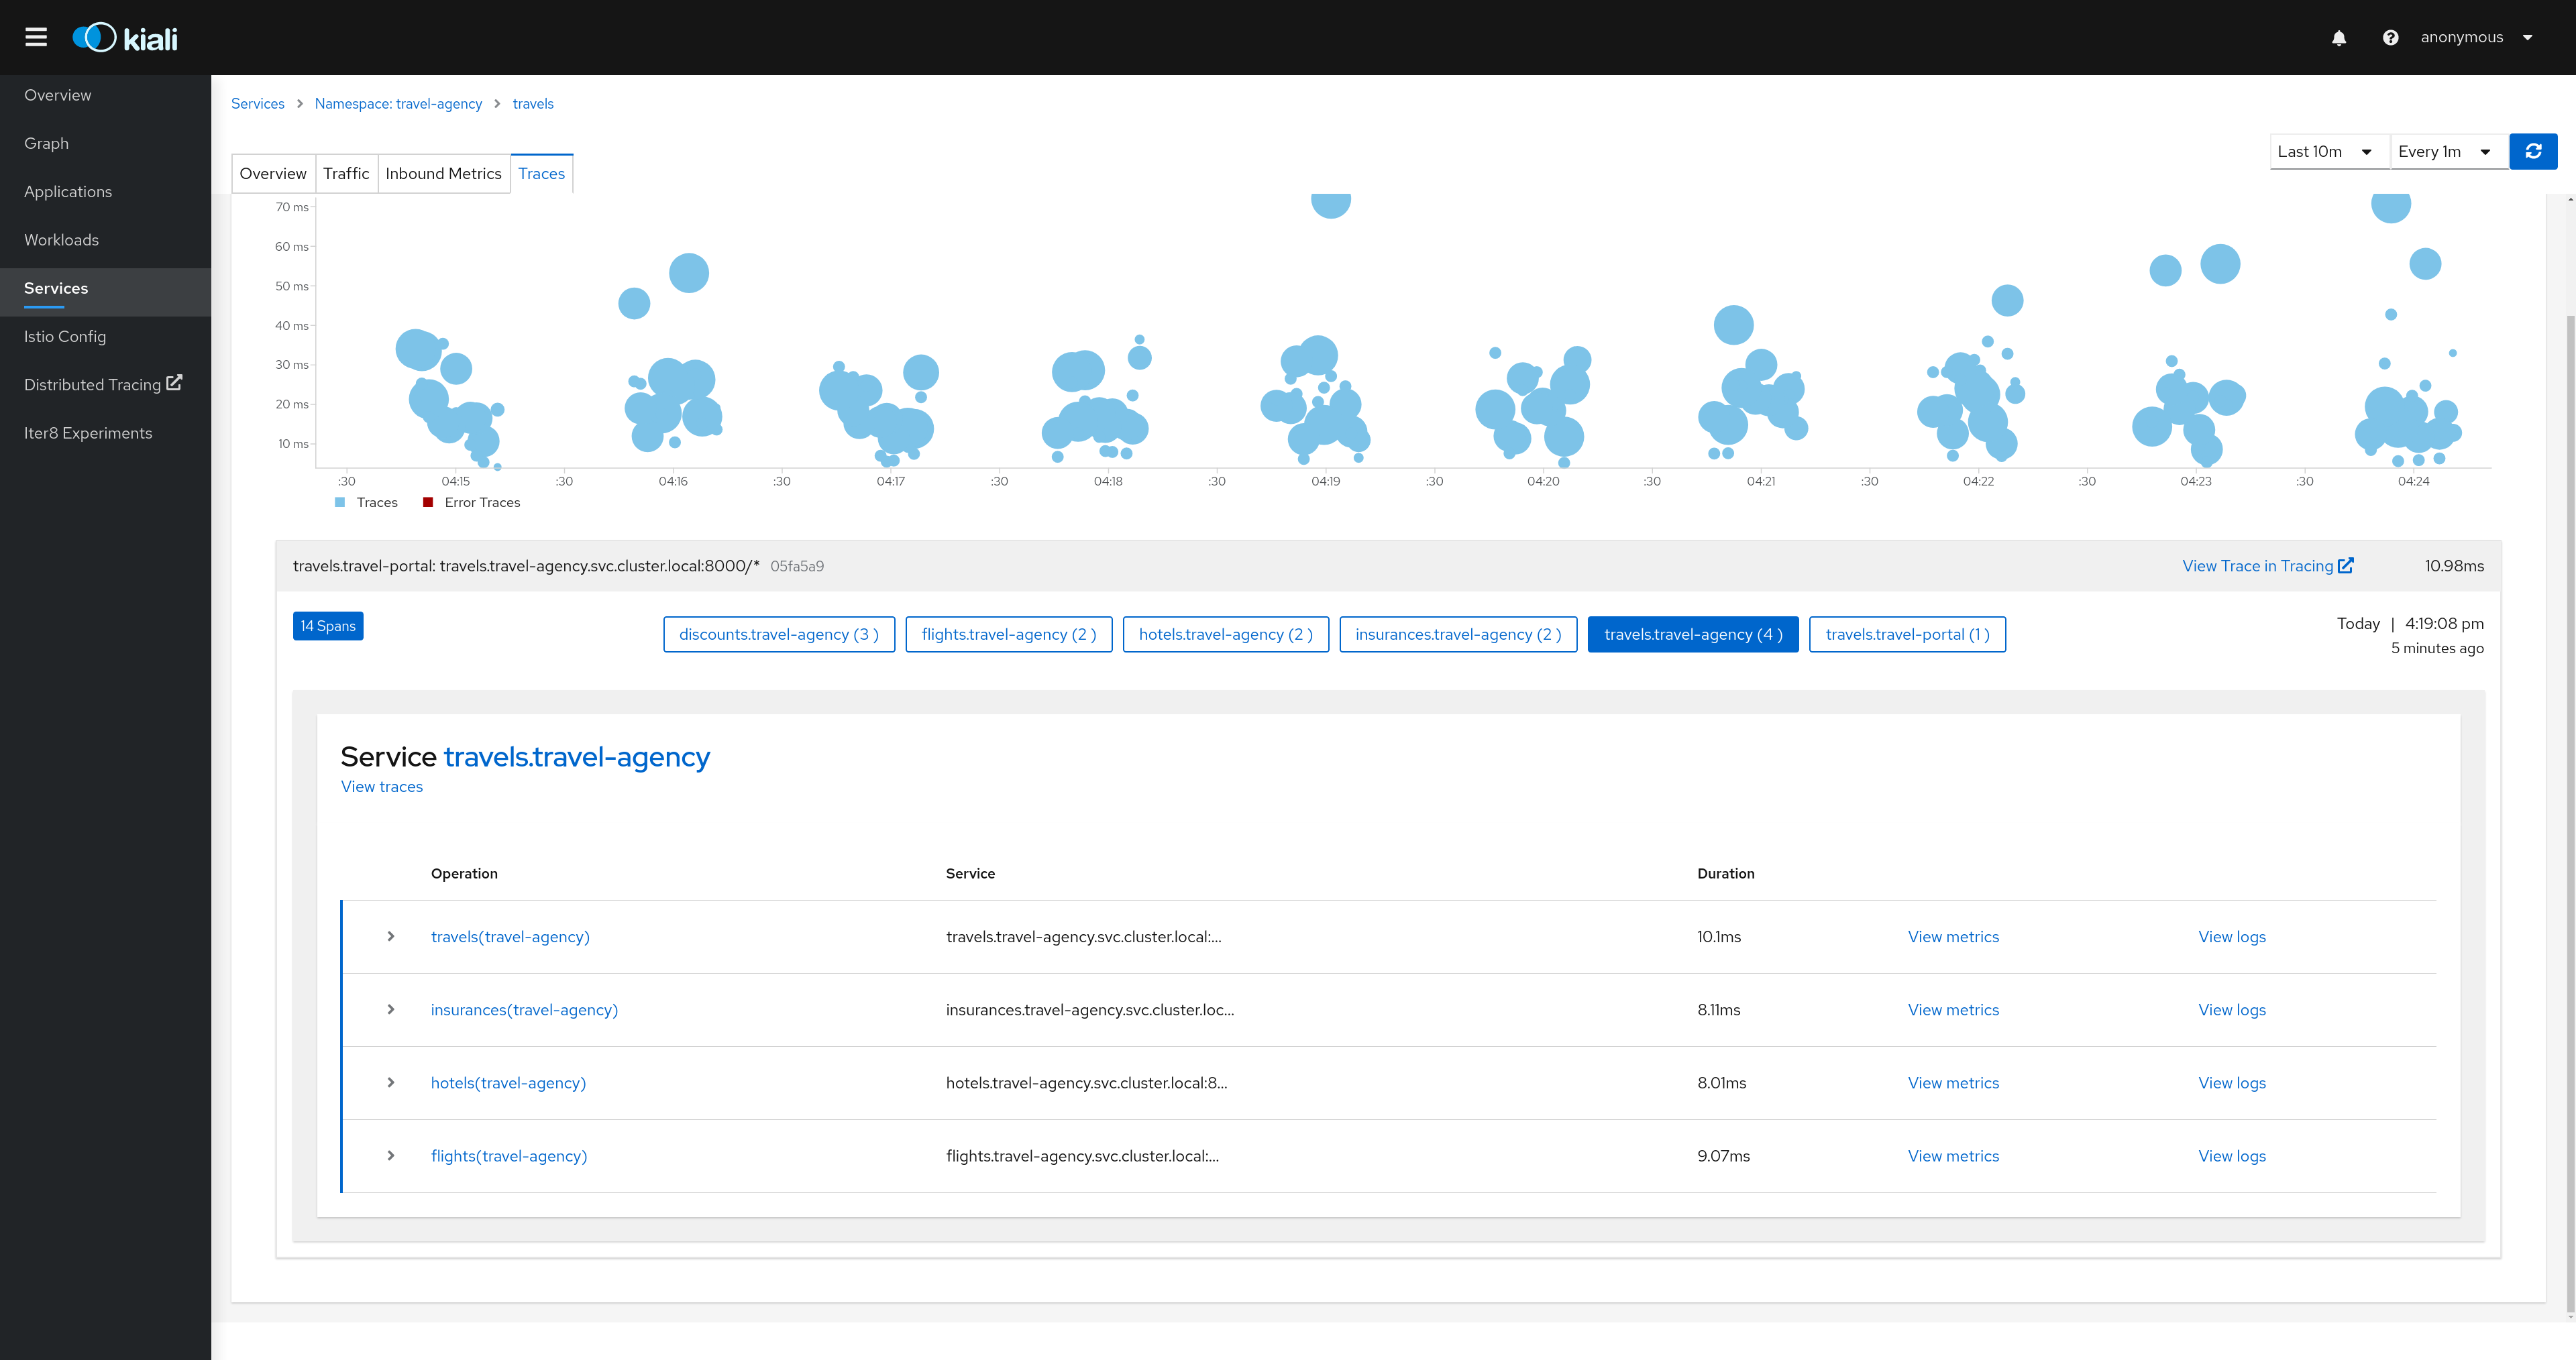
After selecting a trace, Kiali shows the information related to that trace like number of spans, spans grouped by operation name, duration, date.
Configuration and Validation Features
Kiali is more than observability, it also helps you to configure, update and validate your Istio service mesh.
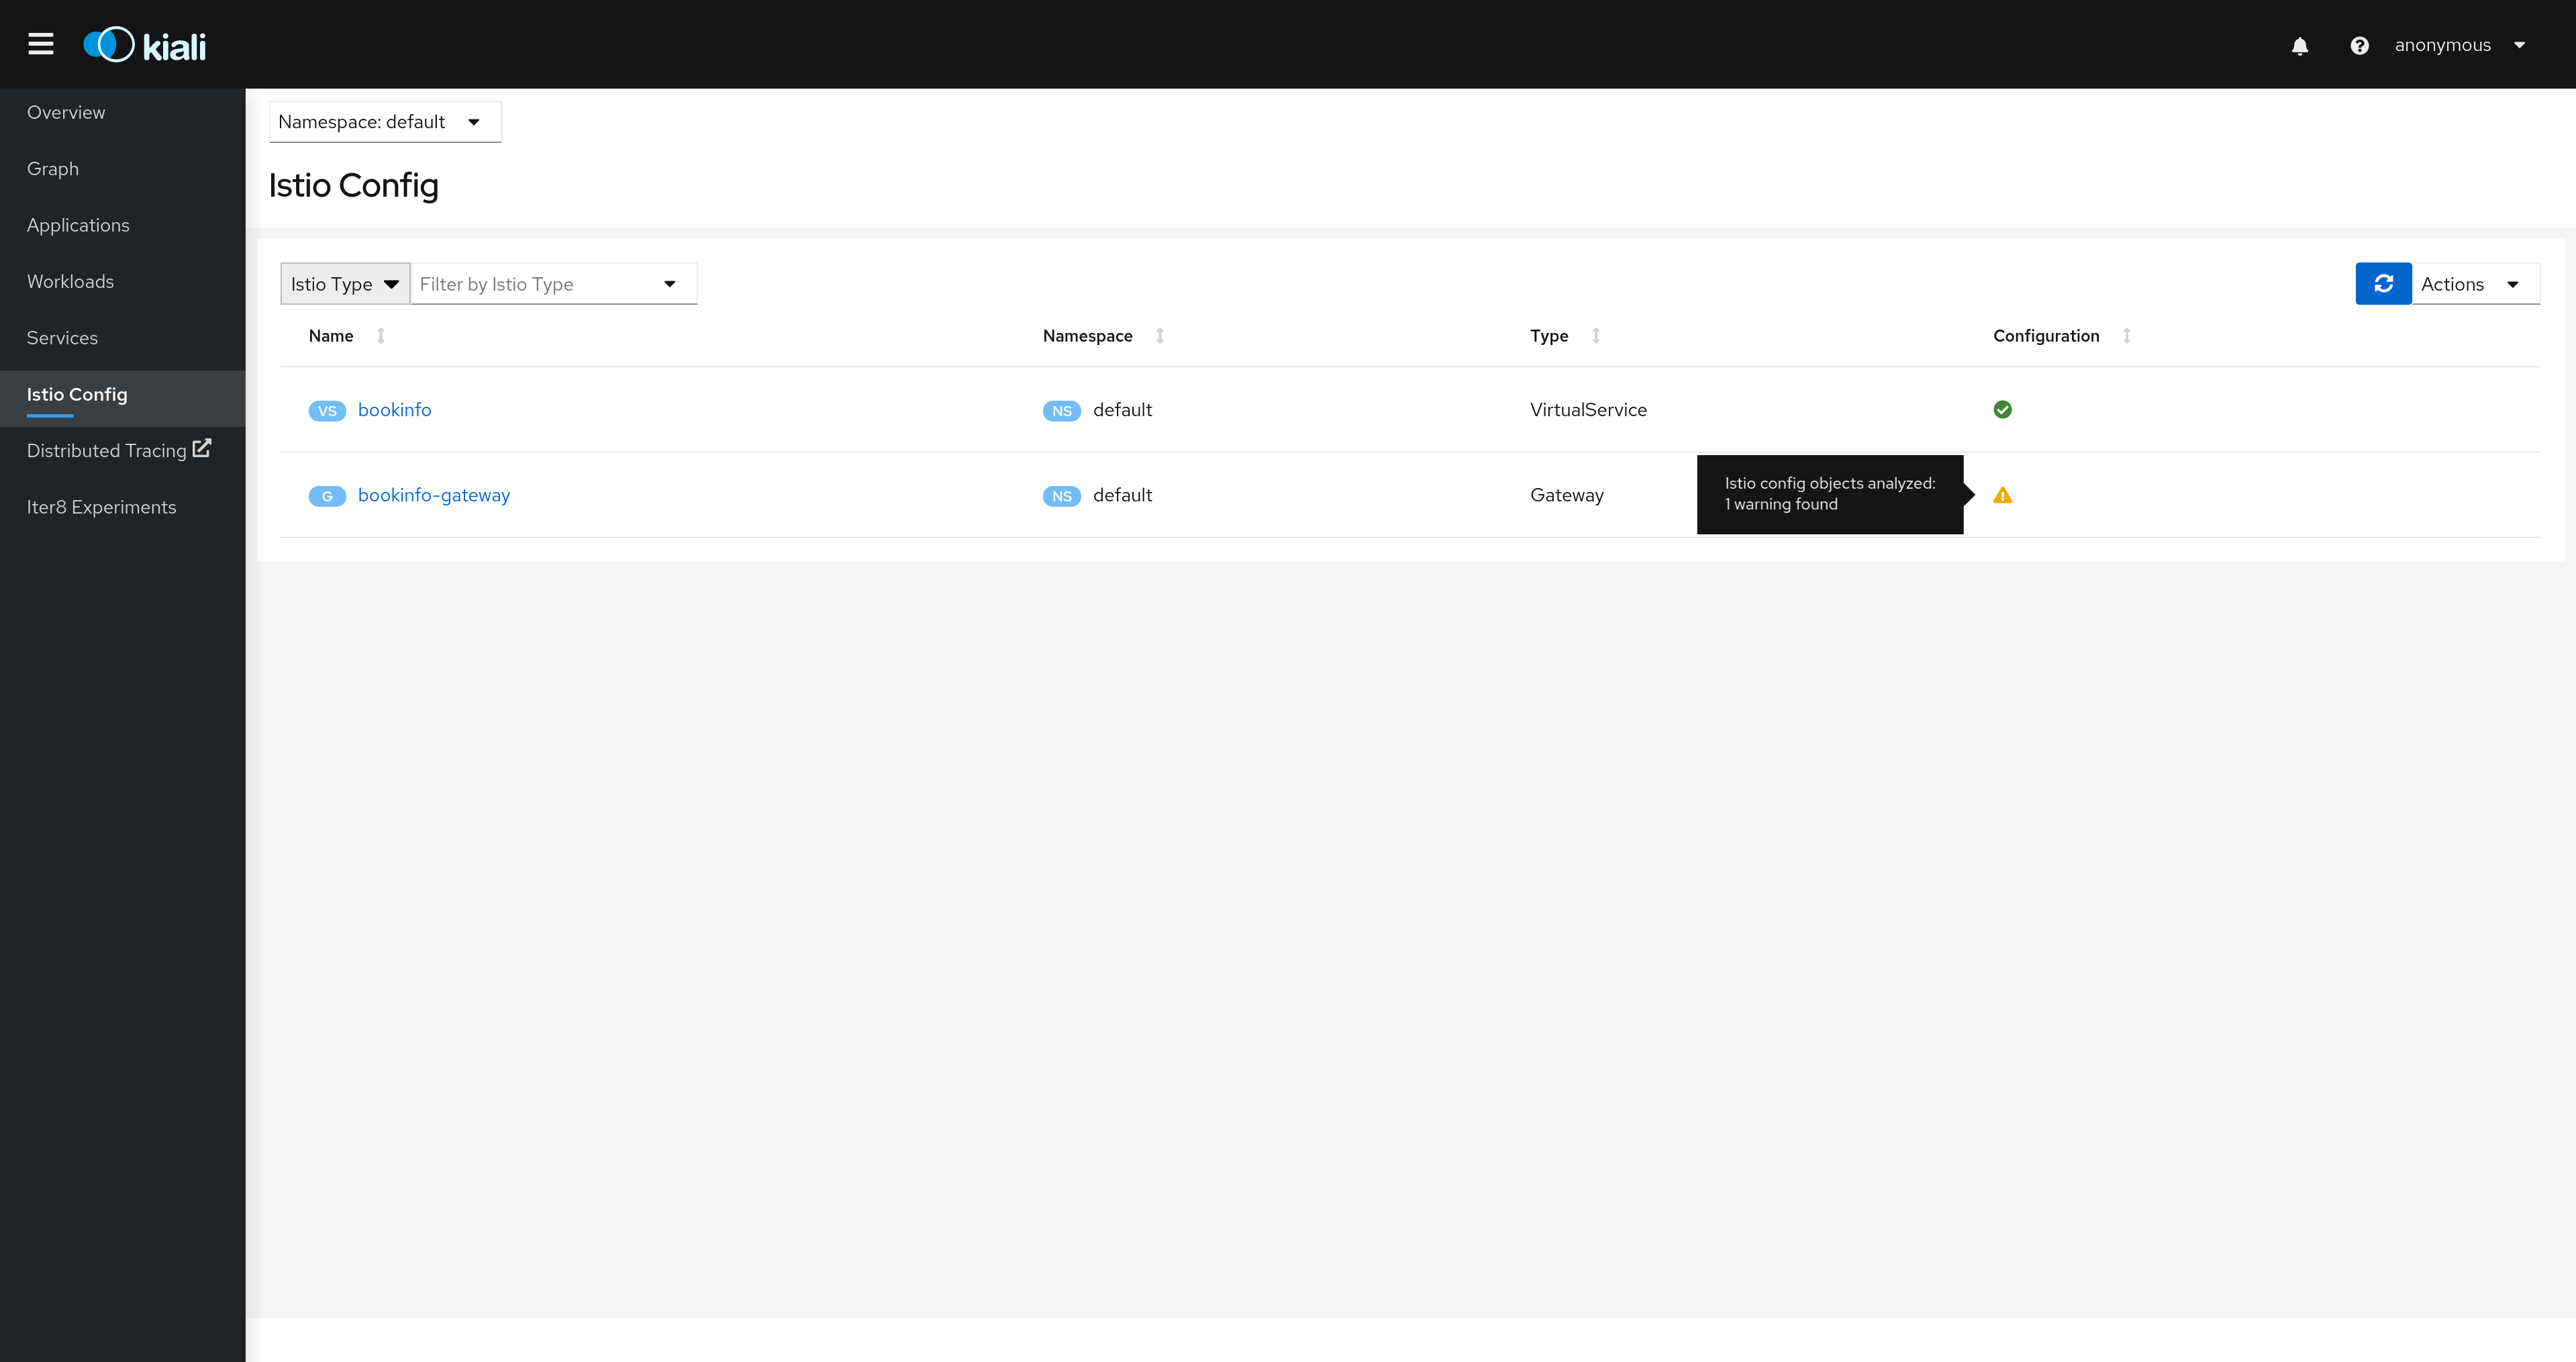
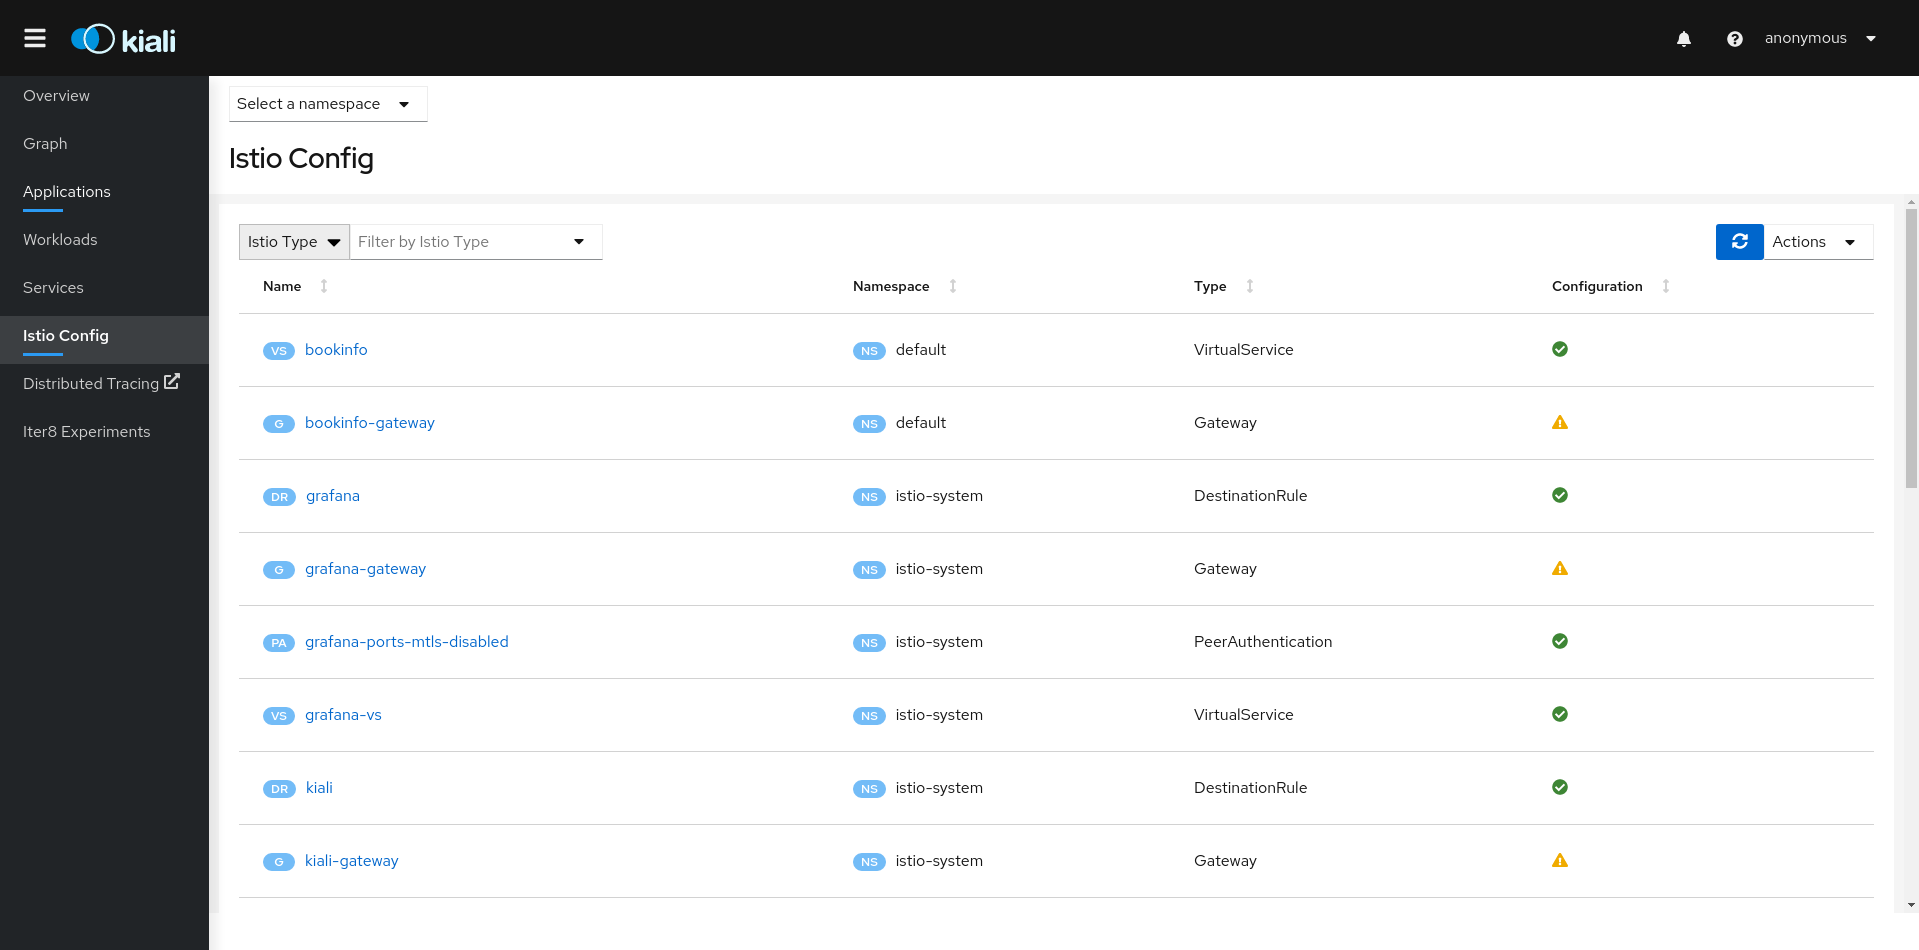
Istio Configuration
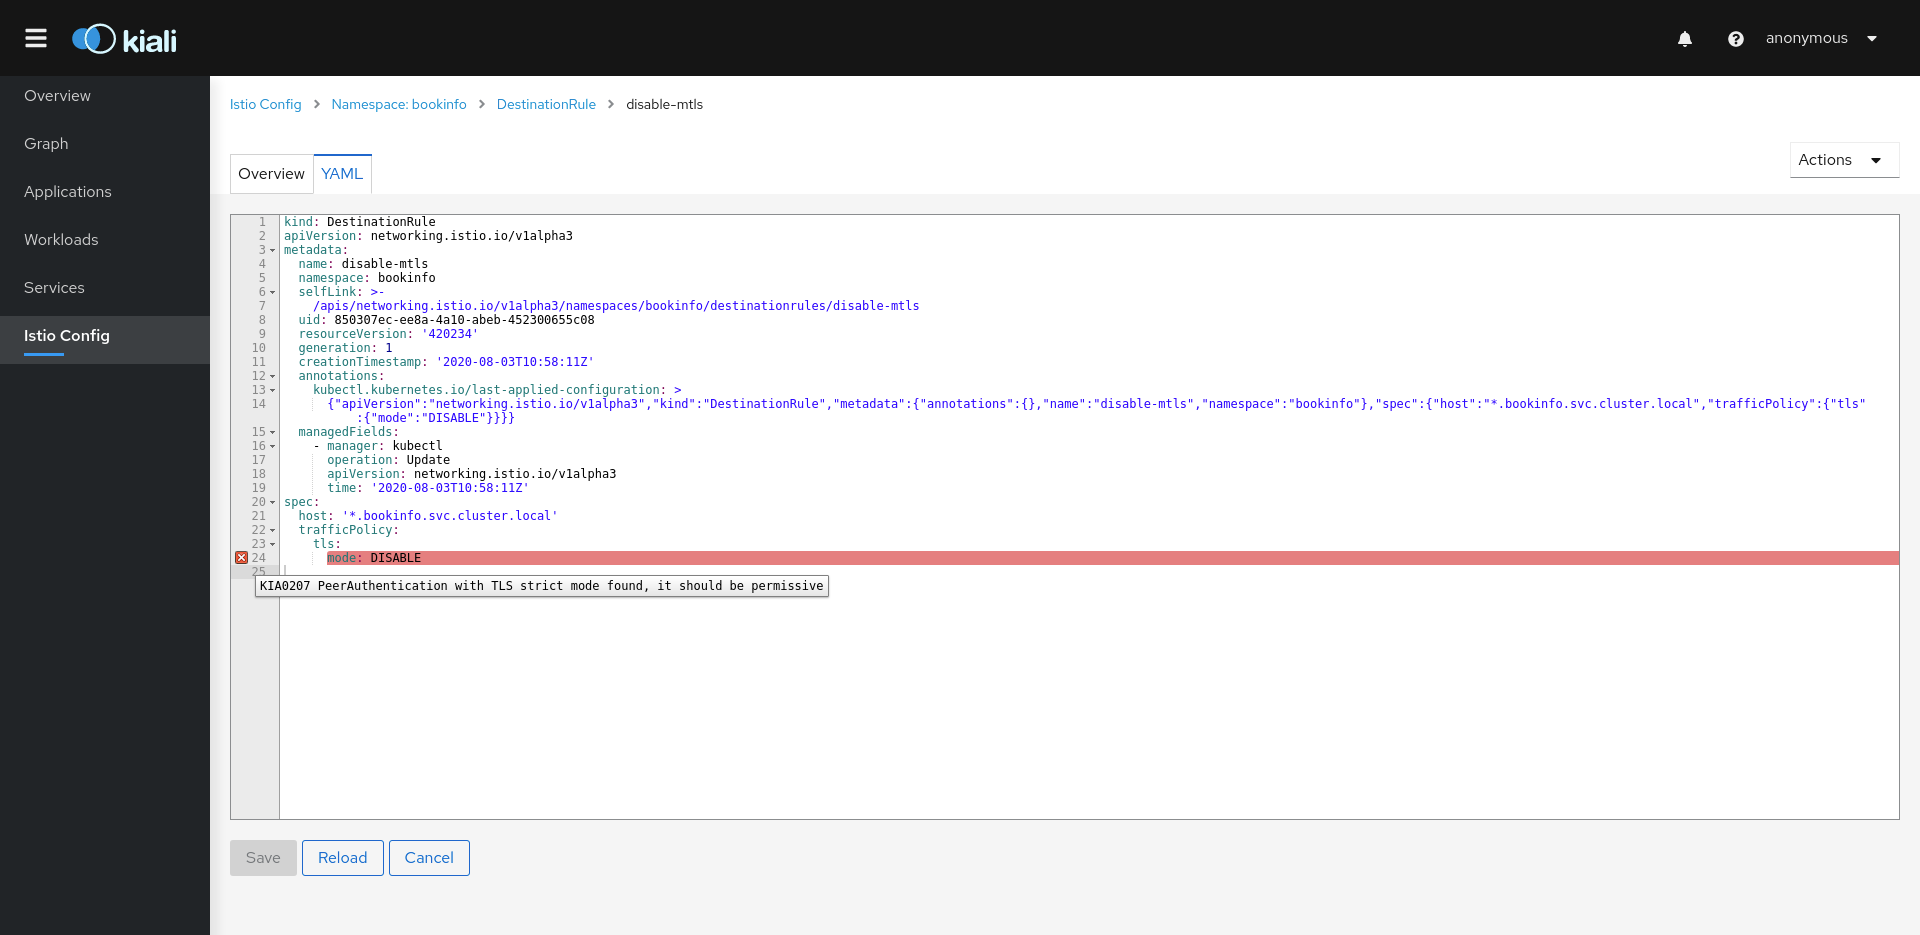
The Istio configuration view provides advanced filtering and navigation for Istio configuration objects such as Virtual Services and Gateways. Kiali provides inline config edition and powerful semantic validation for Istio resources.
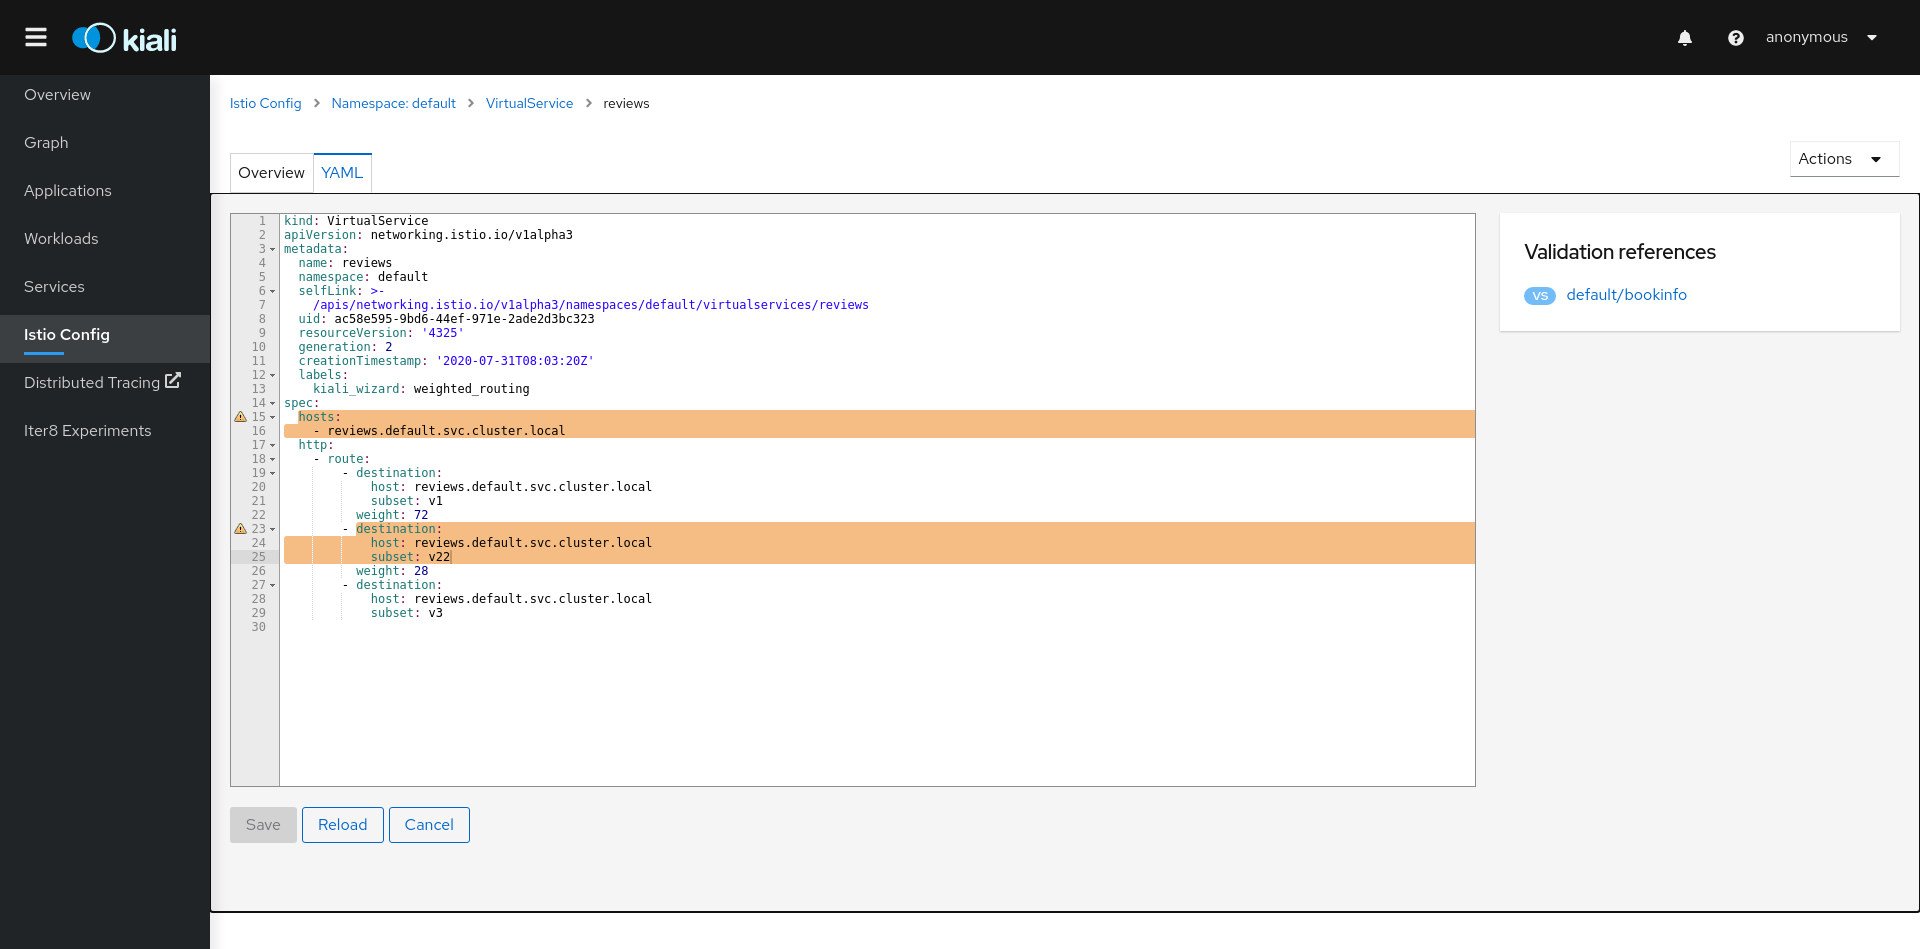
Validations
Kiali performs a set of validations to the most common Istio Objects such as Destination Rules, Service Entries, and Virtual Services. Those validations are done in addition to the existing ones performed by Istio’s Galley component. Most validations are done inside a single namespace only, any exceptions, such as gateways, are properly documented.
Galley validations are mostly syntactic validations based on the object syntax analysis of Istio objects while Kiali validations are mostly semantic validations between different Istio objects. Kiali validations are based on the runtime status of your service mesh, Galley validations are static ones and doesn’t take into account what is configured in the mesh.
Check the complete list of validations for further information.
Istio Wizards
Kiali provides actions to create, update and delete Istio configuration, driven by wizards.
Actions can be applied to a Service
Actions can also be applied to a Workload
Also, actions are available for an entire Namespace
Service Actions
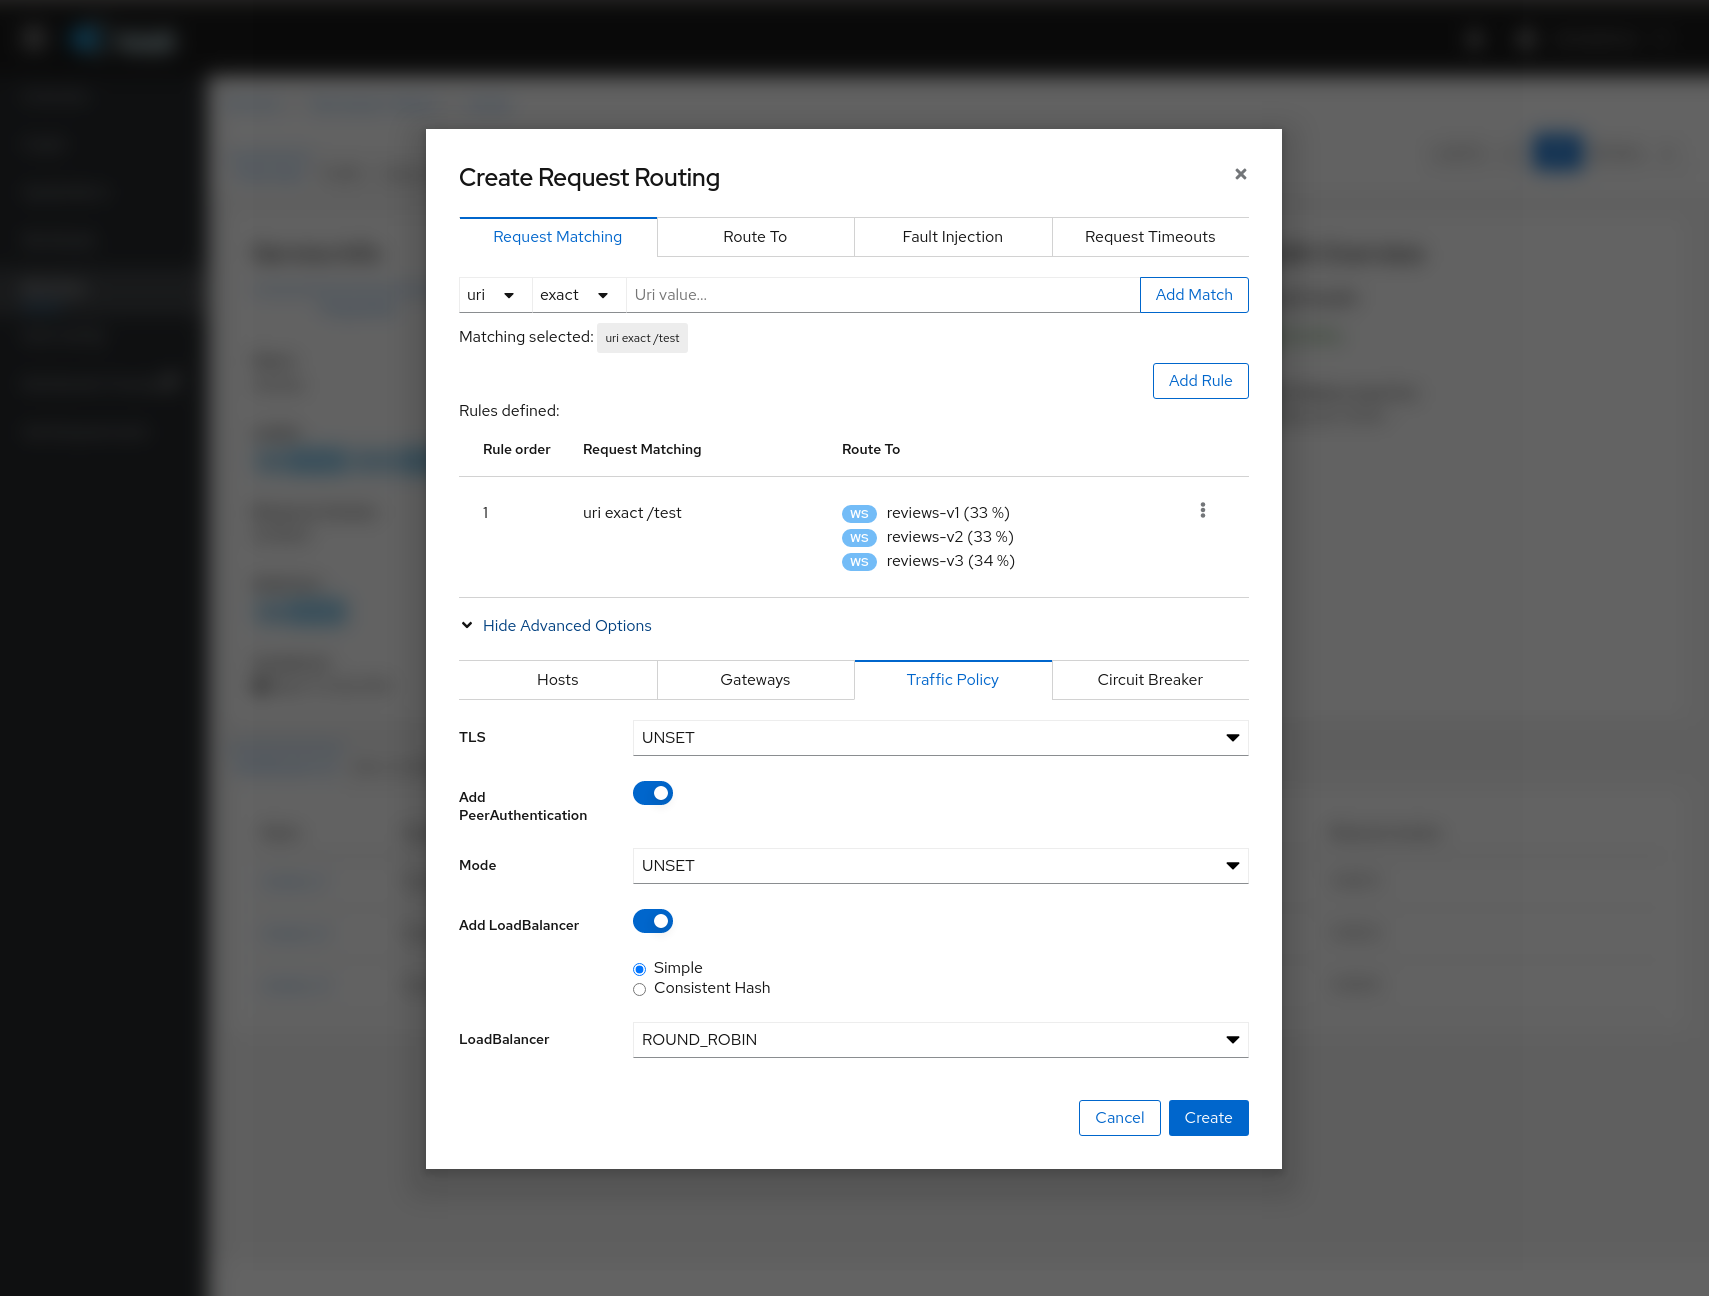
Traffic Management: Request Routing
The Request Routing Wizard allows creating multiple routing rules.
-
Every rule is composed of a Request Matching and a Routes To section.
-
The Request Matching section can add multiple filters using HEADERS, URI, SCHEME, METHOD or AUTHORITY Http parameters.
-
The Request Matching section can be empty, in this case any http request received is matched against this rule.
-
The Routes To section can specify the percentage of traffic that is routed to a specific workload.
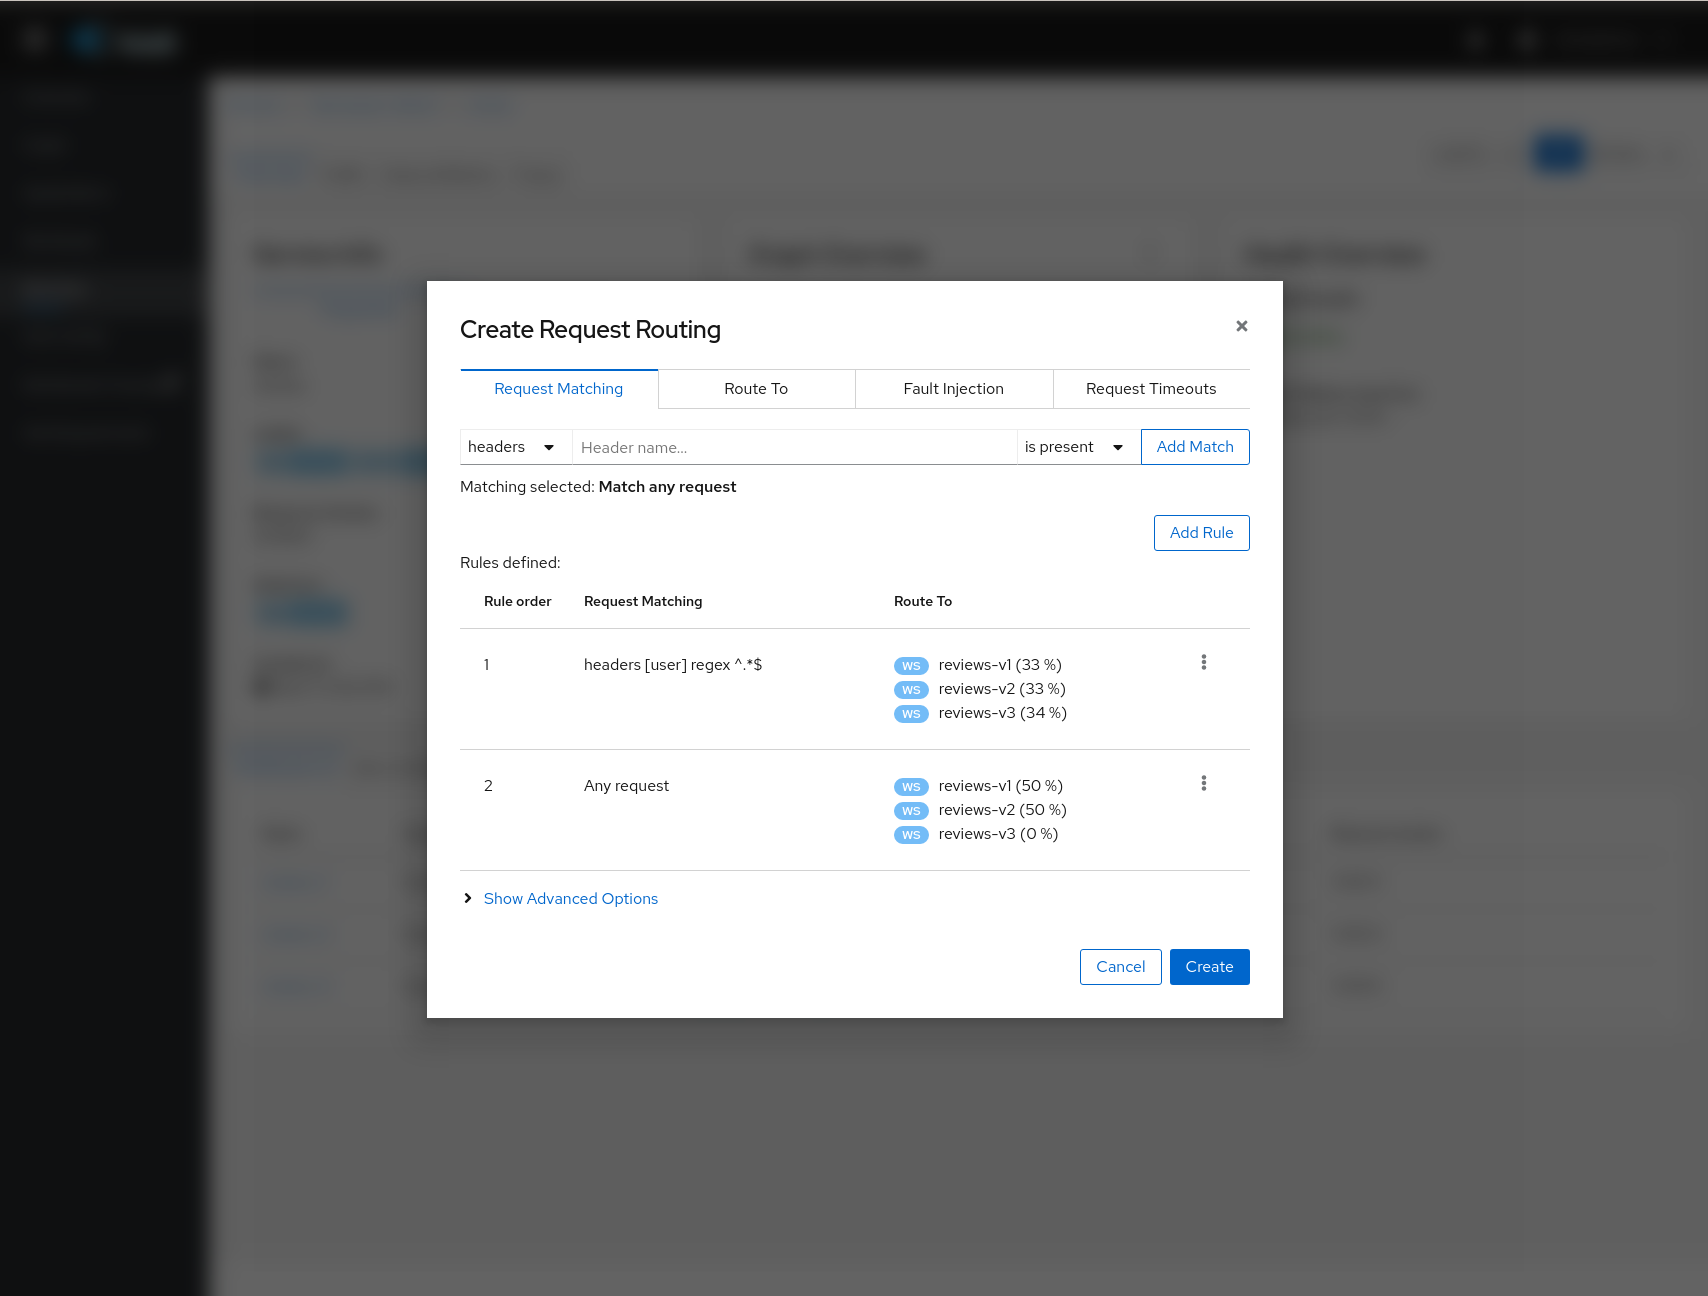
Istio applies routing rules in order, meaning that the first rule matching an HTTP request performs the routing. The Matching Routing Wizard allows changing the rule order.
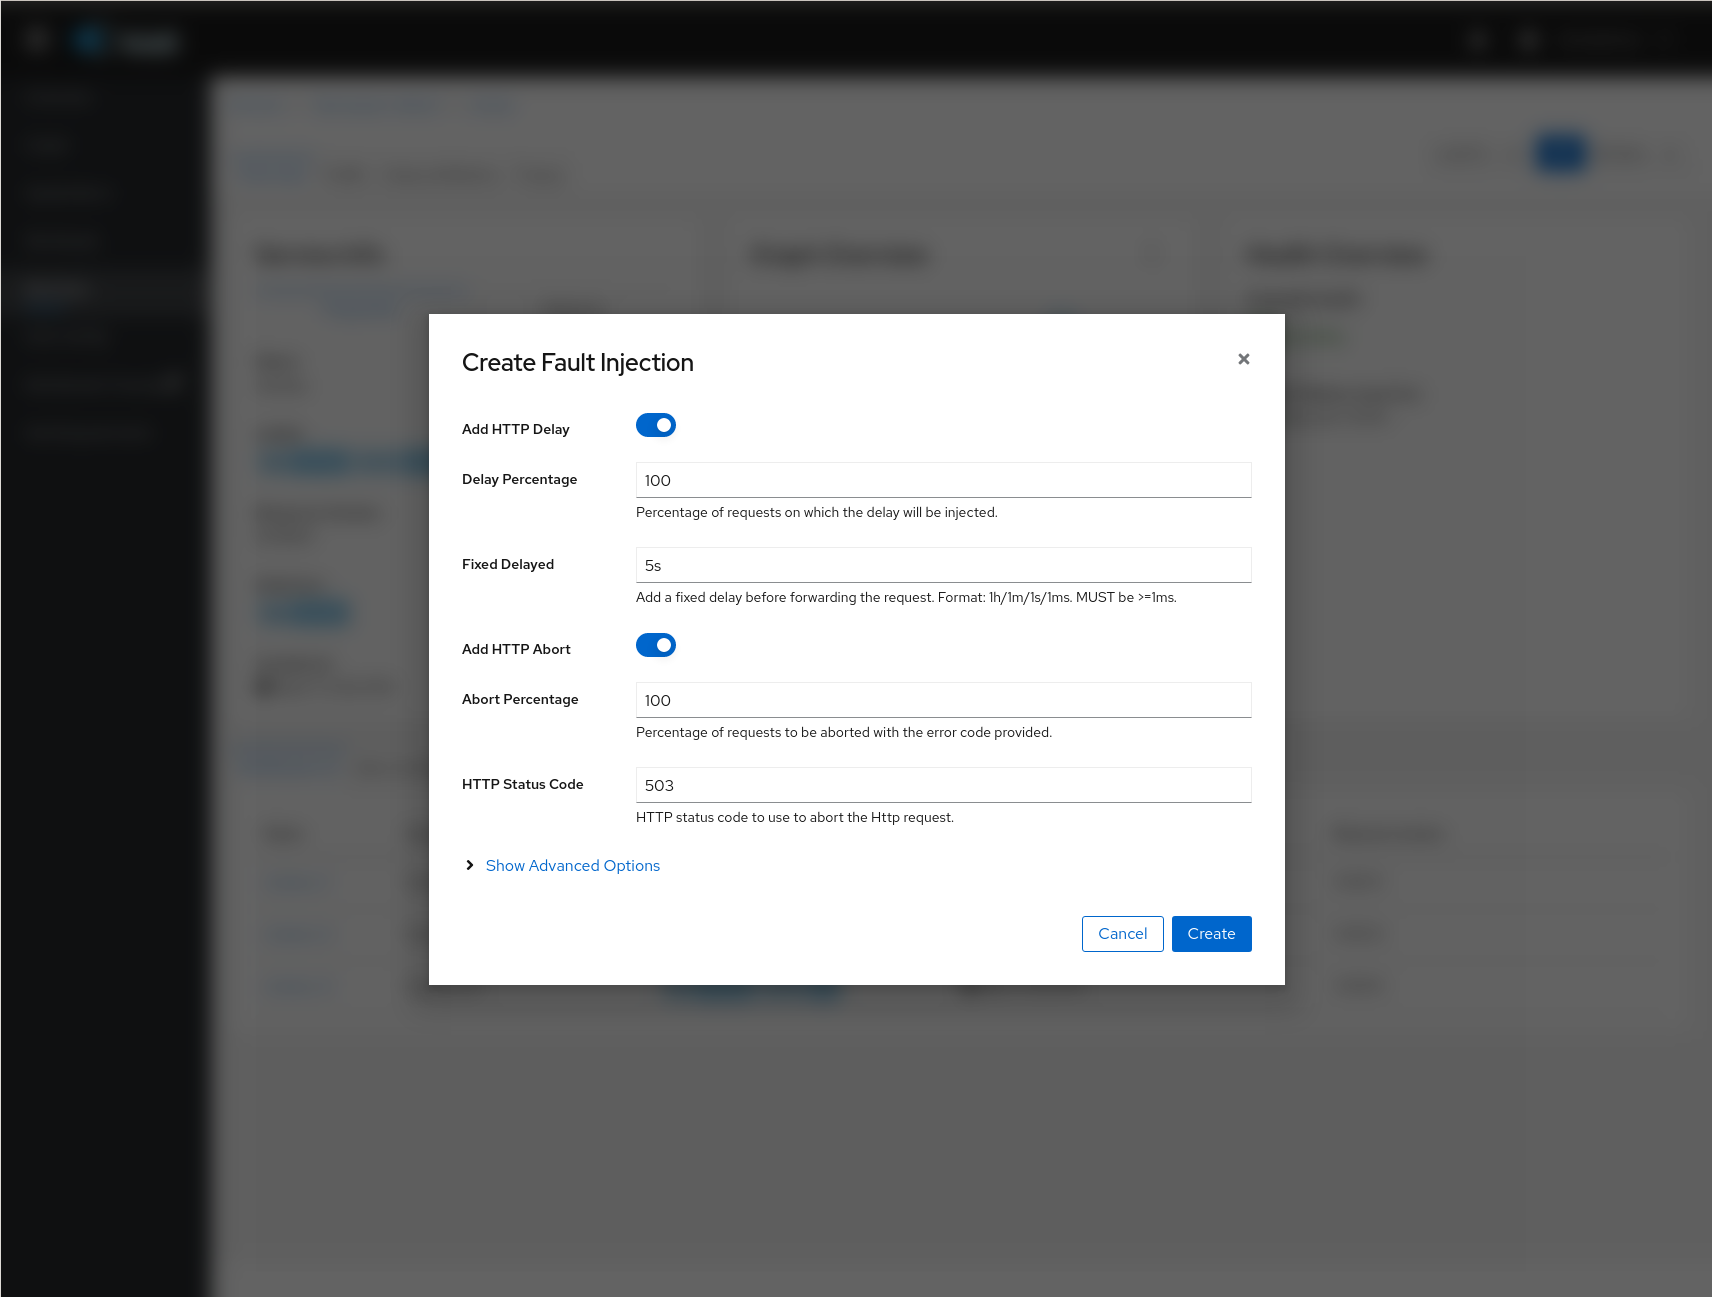
Traffic Management: Fault Injection
The Fault Injection Wizard allows injecting faults to test the resiliency of a Service.
-
HTTP Delay specification is used to inject latency into the request forwarding path.
-
HTTP Abort specification is used to prematurely abort a request with a pre-specified error code.
Traffic Management: Traffic Shifting
The Traffic Shifting Wizard allows selecting the percentage of traffic that is routed to a specific workload.

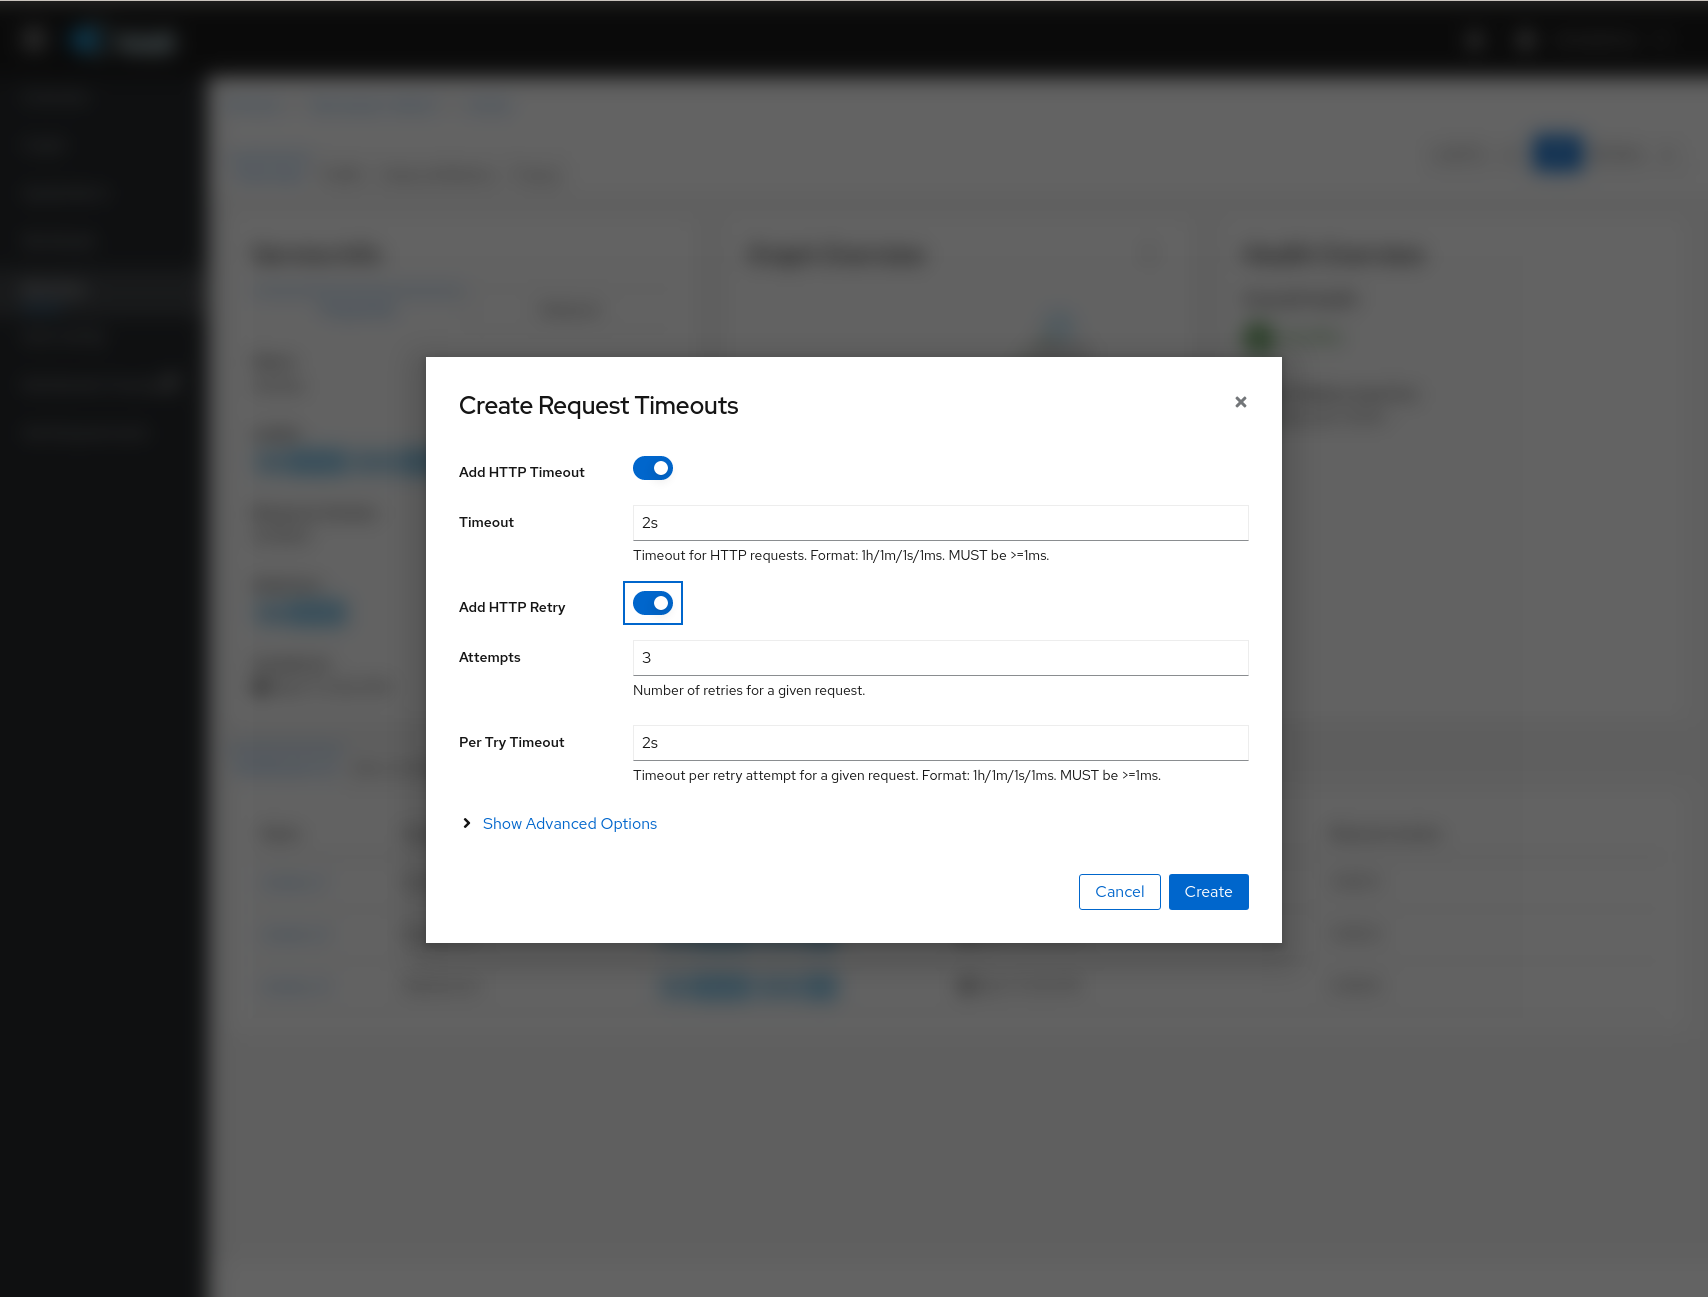
Traffic Management: Request Timeouts
The Request Timeouts Wizard sets up request timeouts in Envoy, using Istio.
-
HTTP Timeout defines the timeout for a request.
-
HTTP Retry describes the retry policy to use when an HTTP request fails.
Traffic Management: Gateways
Traffic Management Wizards have an Advanced Options section that can be used to extend the scenario.
One available Advanced Option is to expose a Service to external traffic through an existing Gateway or to create a new Gateway for this Service.

Traffic Management: Circuit Breaker
Traffic Management Wizards allows defining Circuit Breakers on Services as part of the available Advanced Options.
-
Connection Pool defines the connection limits for an upstream host.
-
Outlier Detection implements the Circuit Breaker based on the consecutive errors reported.
Security: Traffic Policy
Traffic Management Advanced Options allows defining Security and Load Balancing settings.
-
TLS related settings for connections to the upstream service.
-
Automatically generate a PeerAuthentication resource for this Service.
-
Load balancing policies to apply for a specific destination.
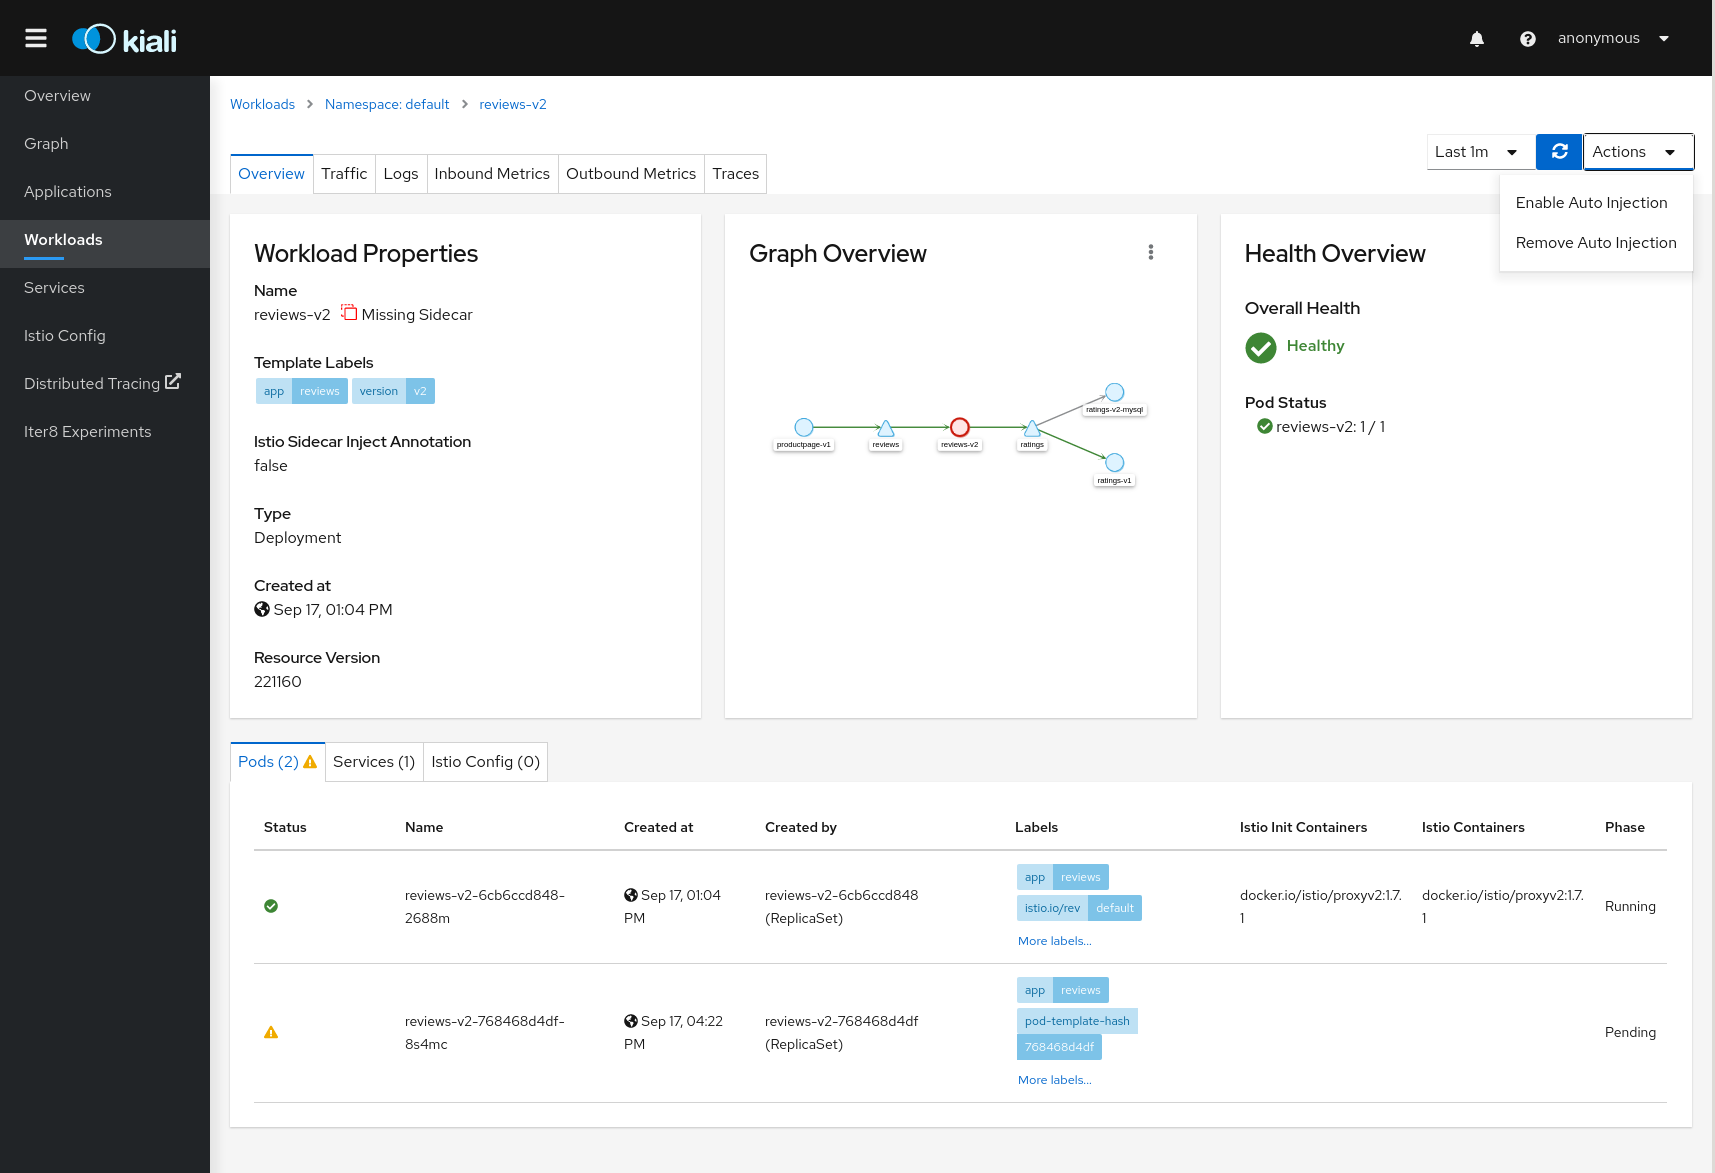
Workload Actions
Automatic Sidecar Injection
A Workload can be individually annotated to control the Sidecar Injection.
A default scenario is to indicate this at Namespace level but there can be cases where a Workload shouldn’t be part of the Mesh or vice versa.
Kiali allows users to annotate the Deployment template and propagate this configuration into the Pods.
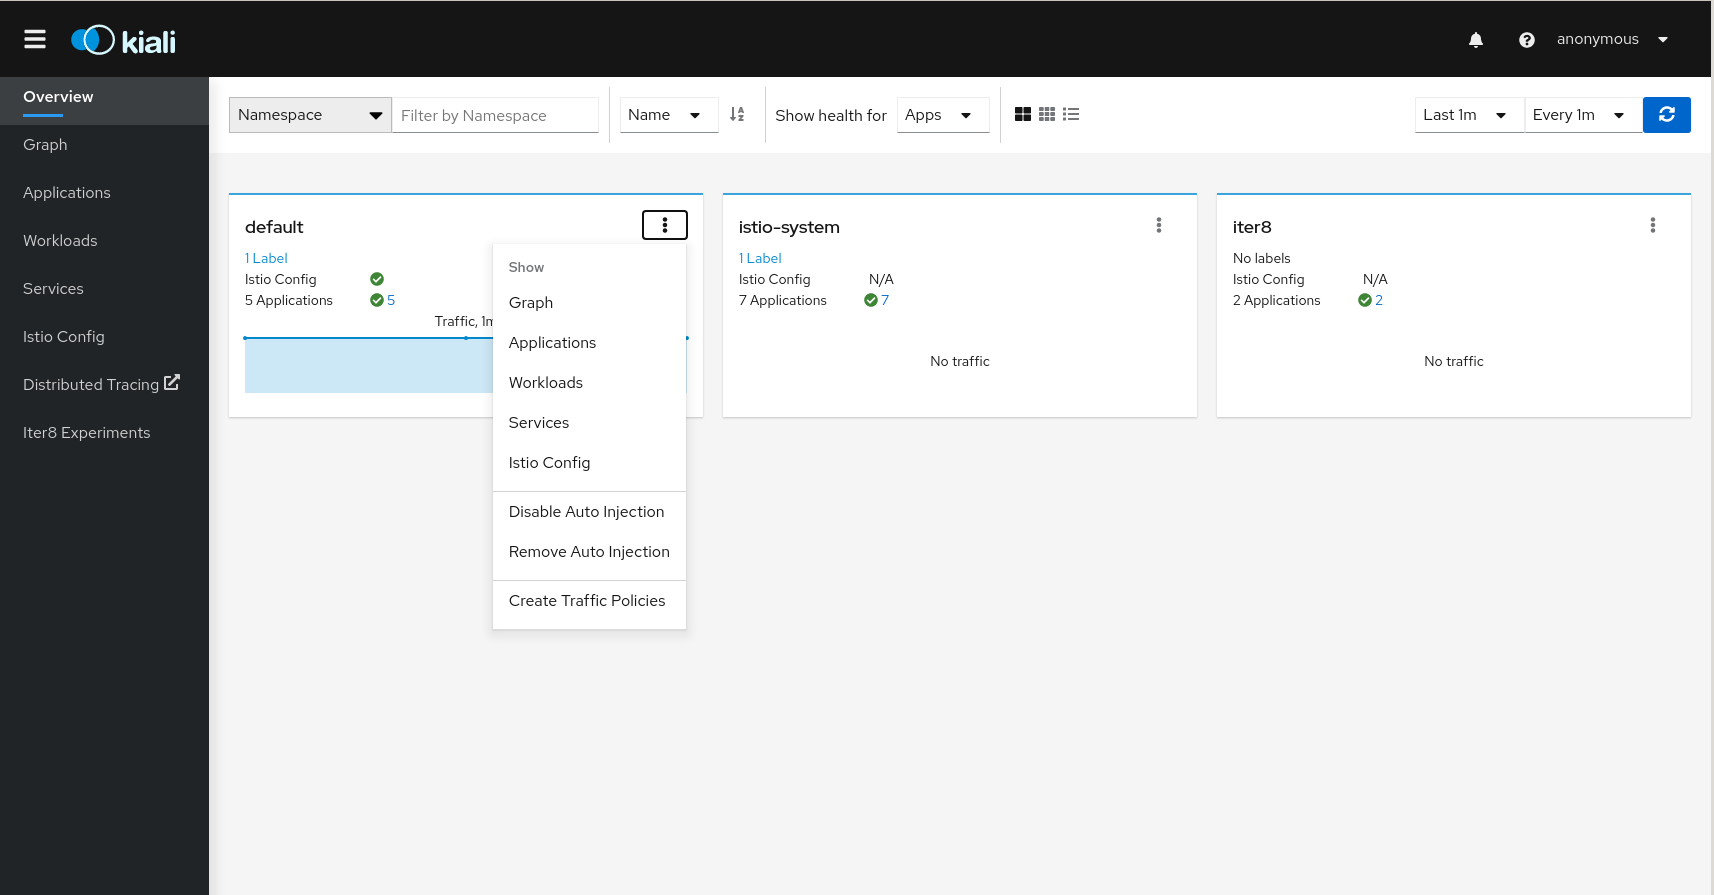
Namespace Actions
The Kiali Overview page offers several Namespace actions, in any of its views: Expanded, Compacted or Table.
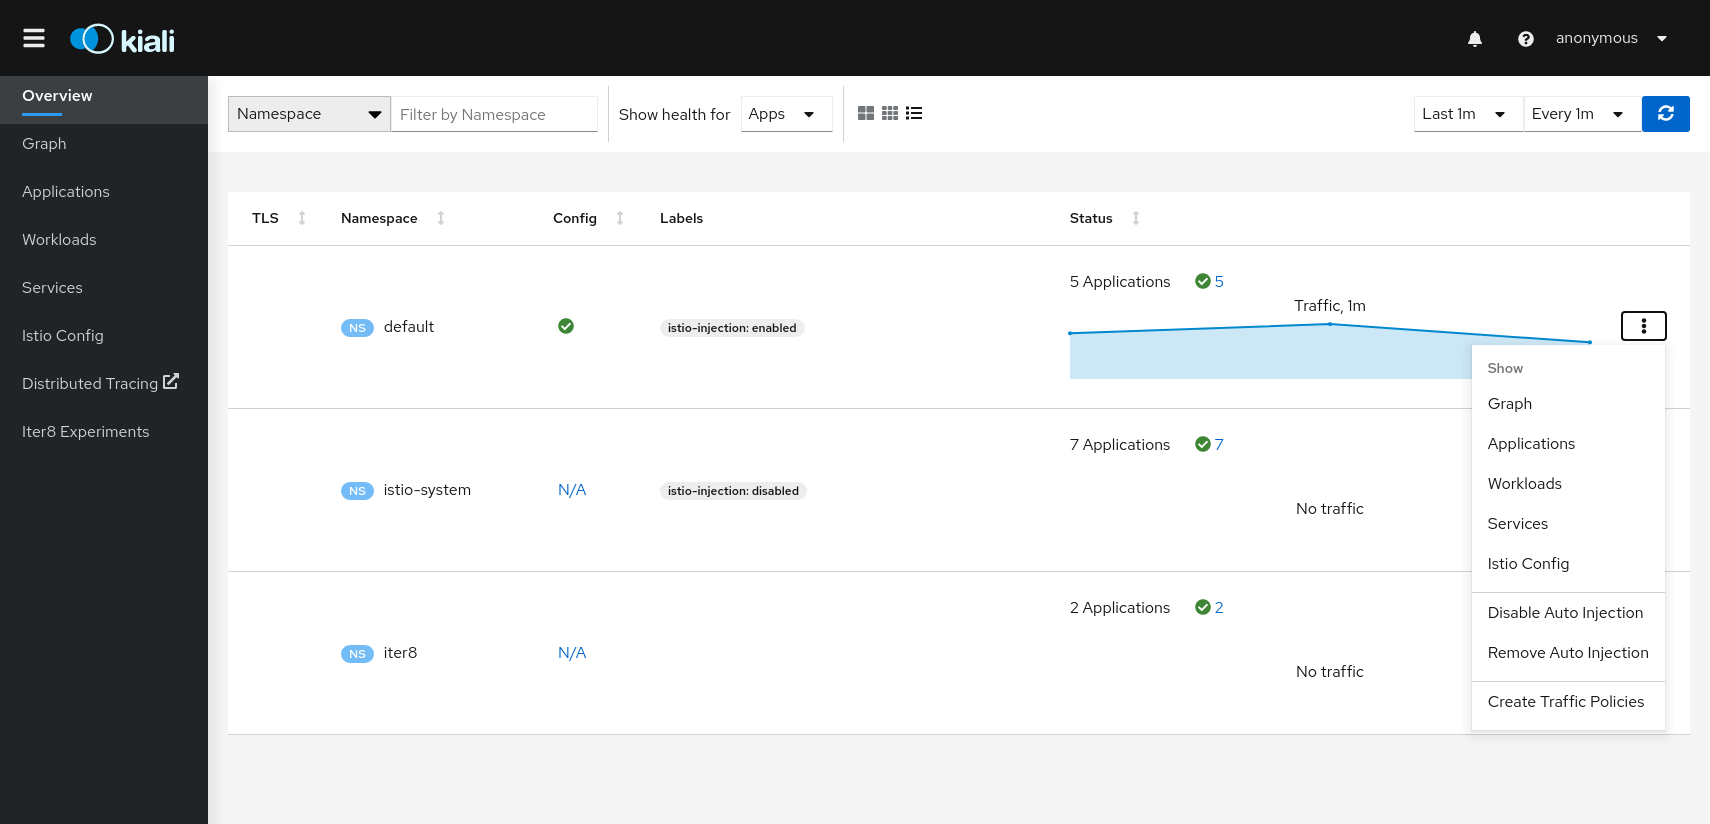
Show
Show actions navigate from a Namespace to its specific Graph, Applications, Workloads, Services or Istio Config pages.
Automatic Sidecar Injection
When Automatic Sidecar Injection is enabled in the cluster, a Namespace can be labeled to enable/disable the injection webhook, controlling whether new deployments will automatically have a sidecar.
Security: Traffic Policies
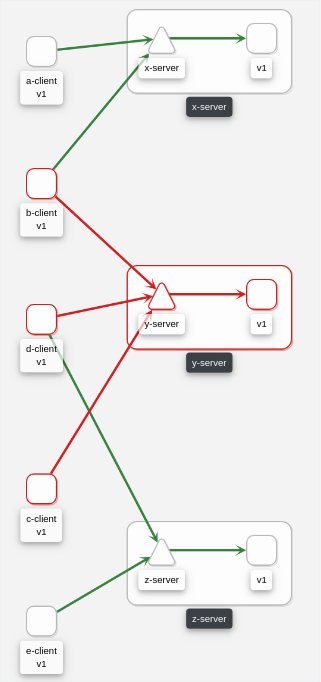
Kiali can generate Traffic Policies based on the traffic for a namespace.
For example, at some point a namespace presents a traffic graph like this:
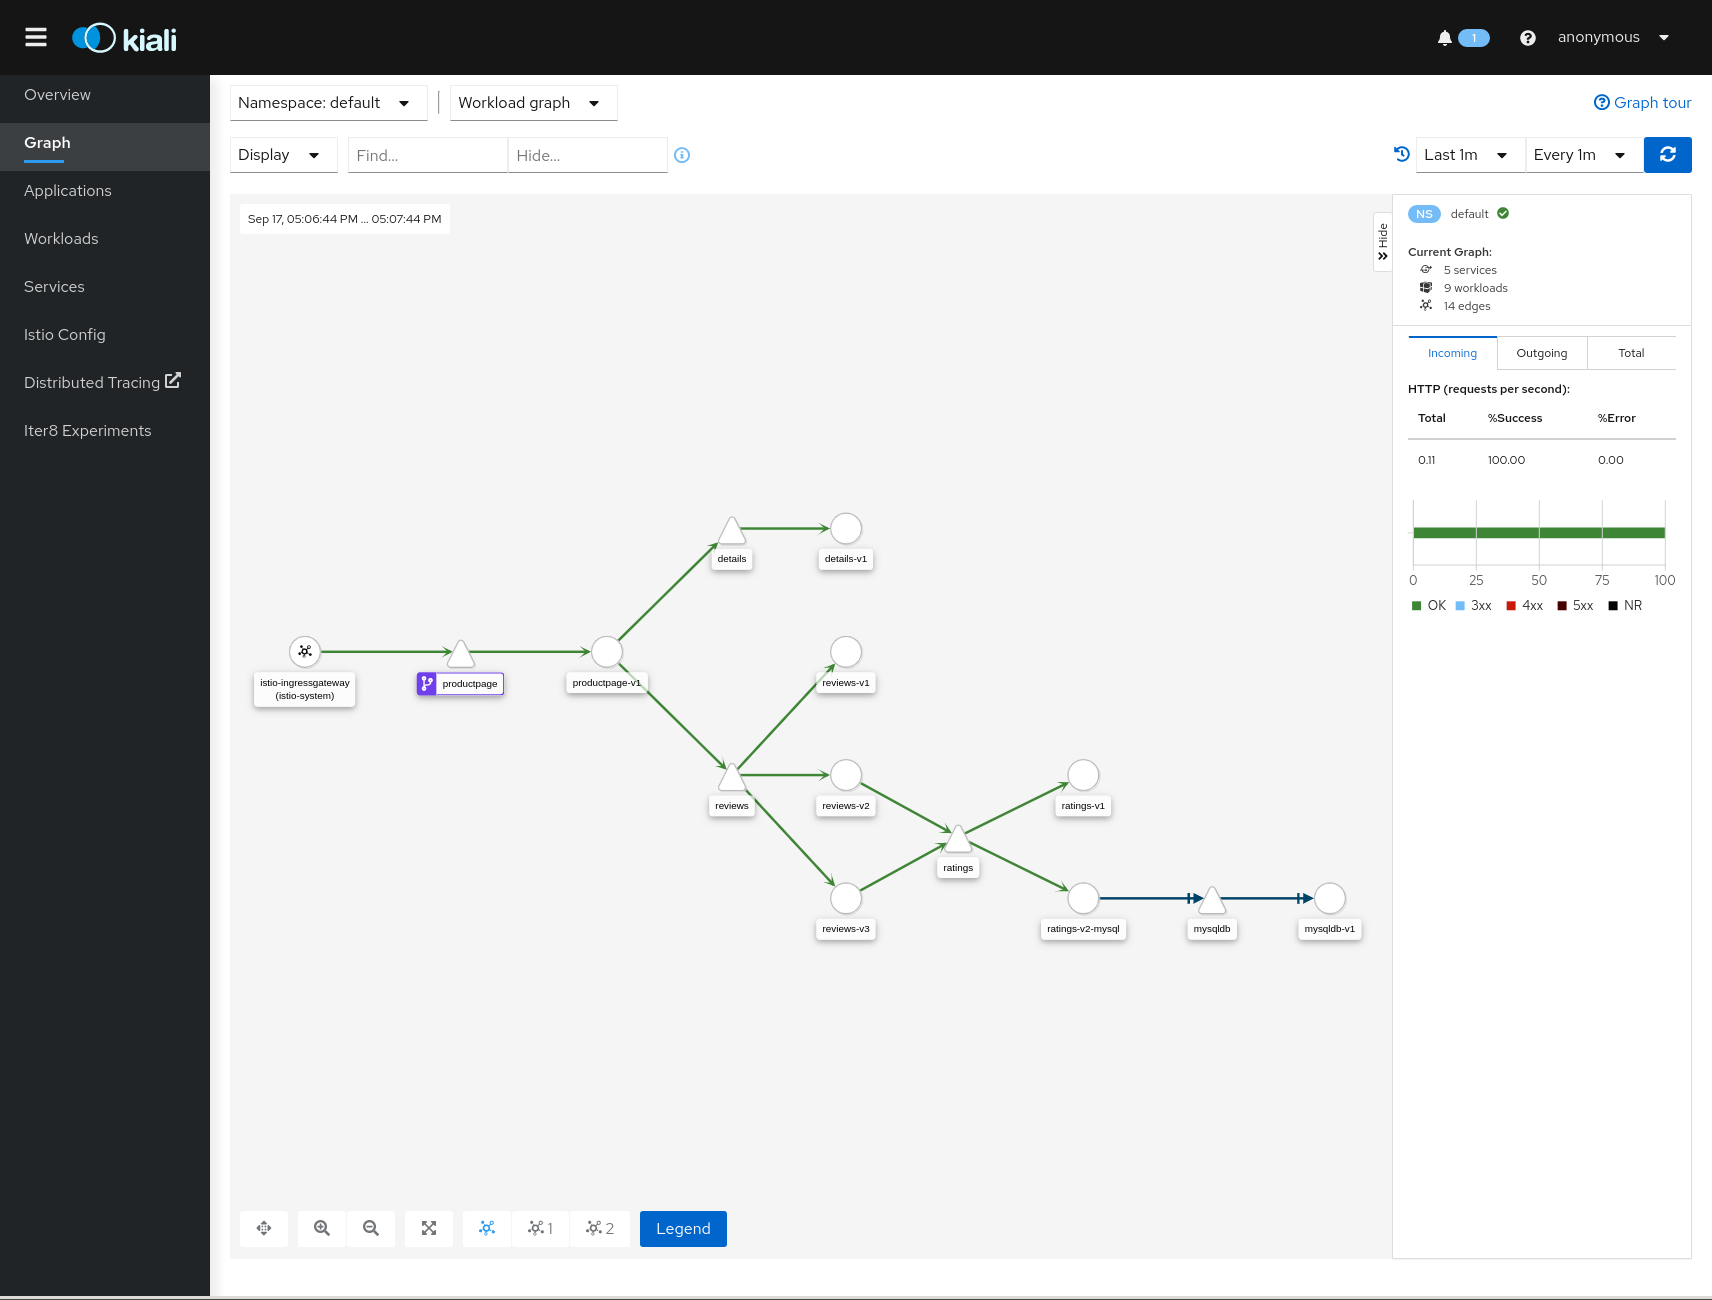
And a user may want to add Traffic Policies to secure that communication. In other words, to prevent traffic other than that currently reflected in the Graph’s Services and Workloads.
Using the Create Traffic Policies action on a namespace, Kiali will generate AuthorizationPolicy resources per every Workload in the Namespace.
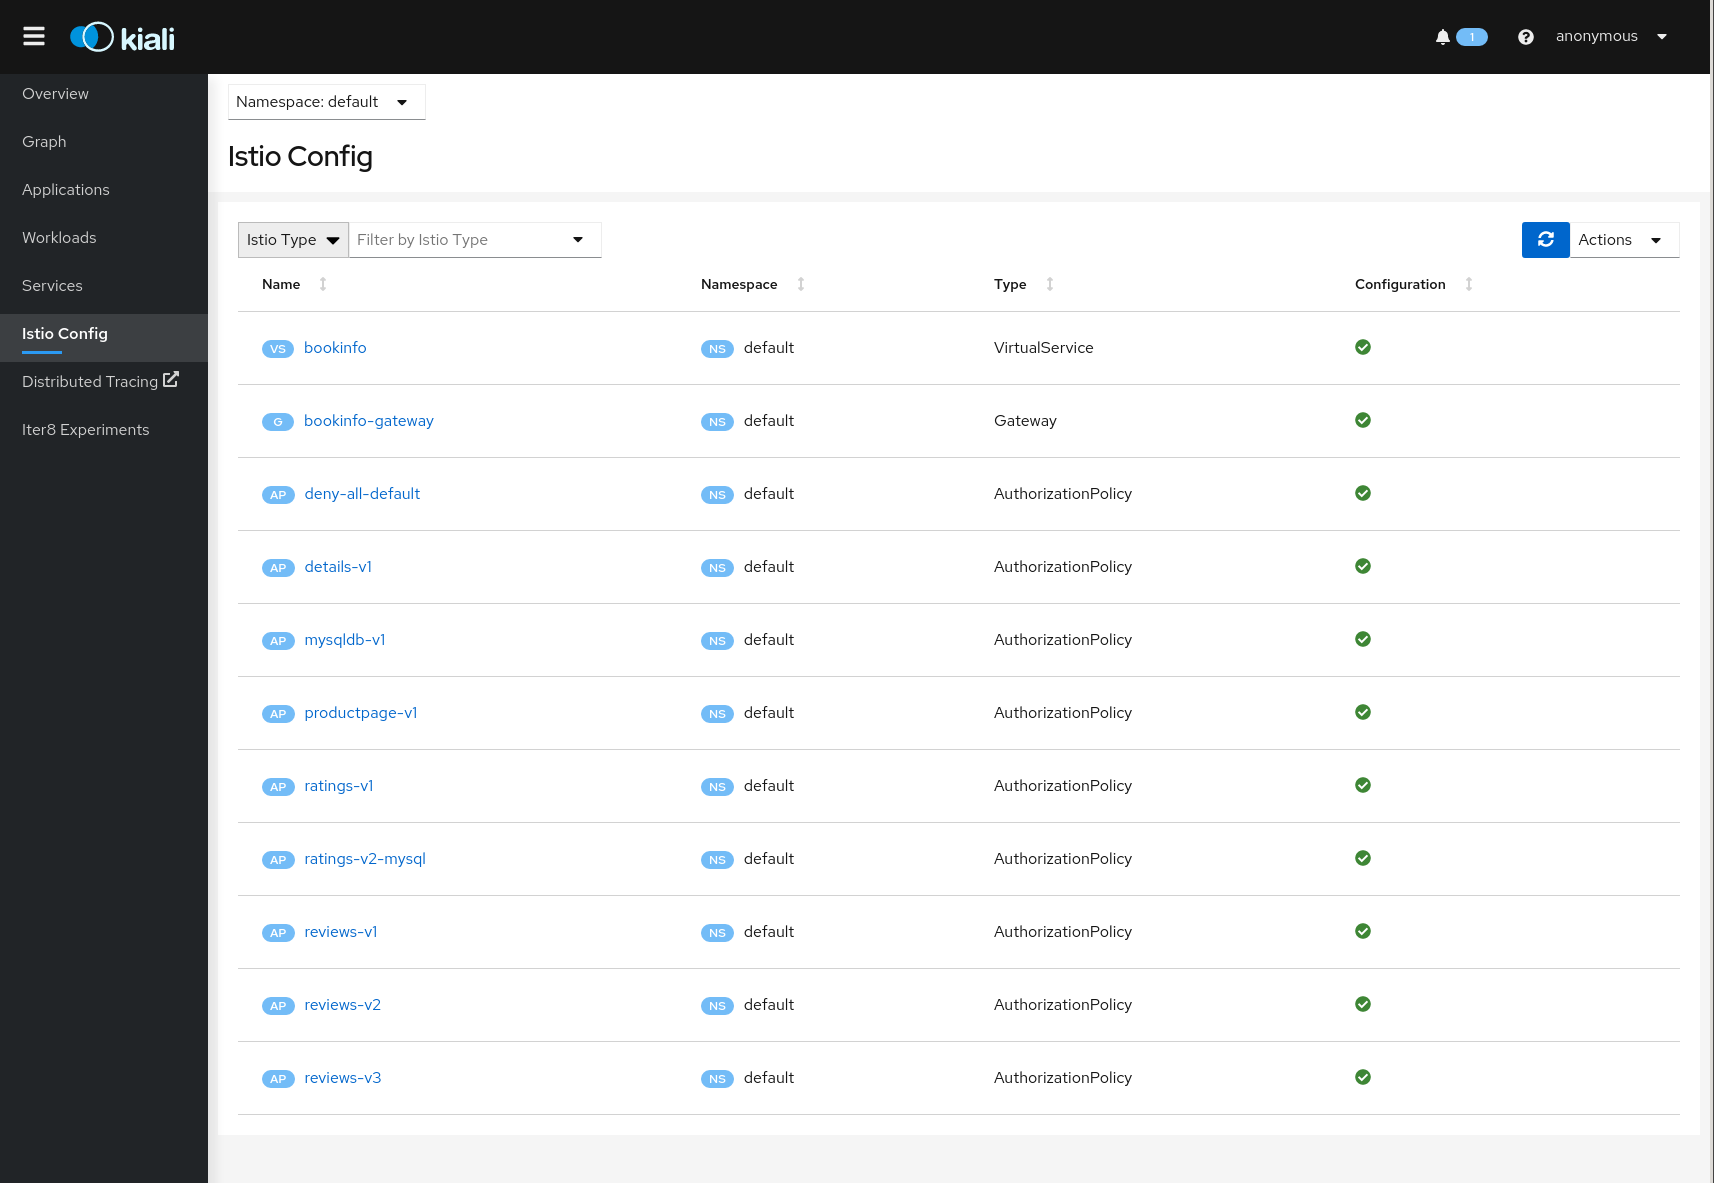
Istio Forms
Istio Wizards provide a way to apply a Service Mesh pattern and let Kiali to generate the Istio Configuration. Kiali also offers actions to create Istio Config for Gateways and Security scenarios.
These actions are located under the Istio Config page.
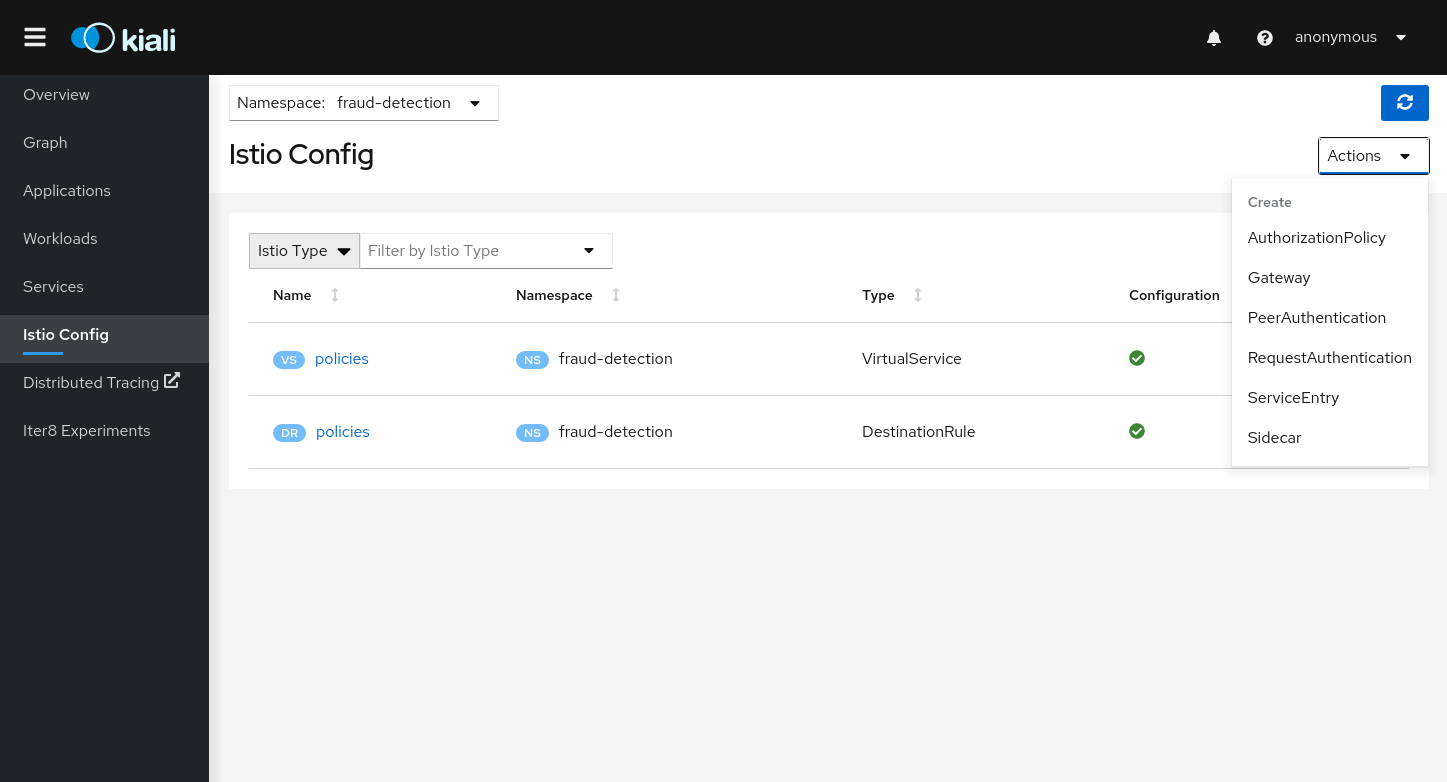
Istio Security Forms
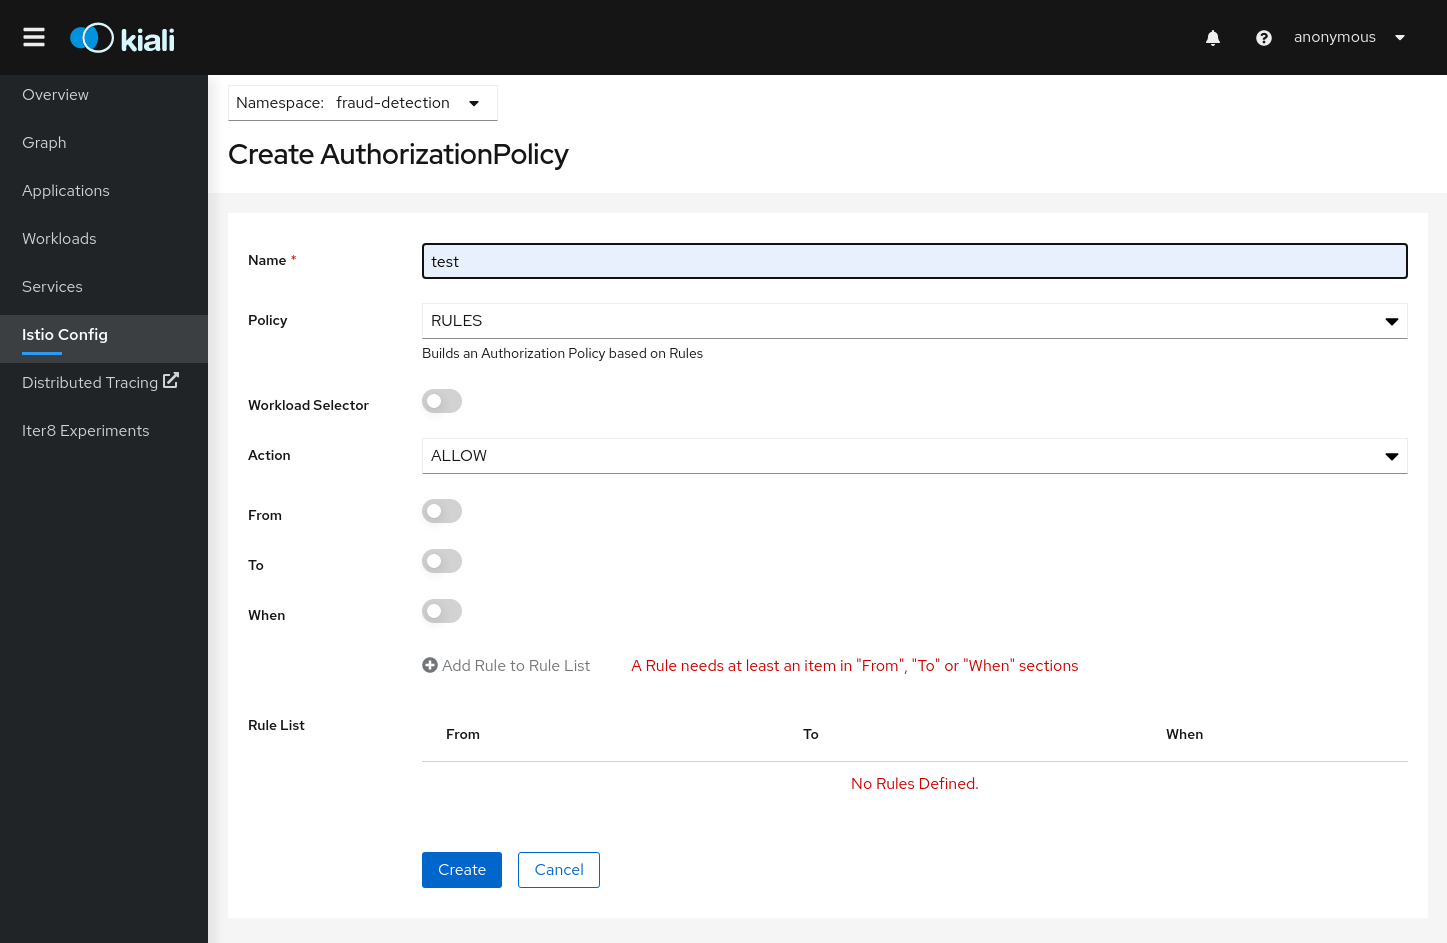
Kiali allows creation of Istio AuthorizationPolicy resources:
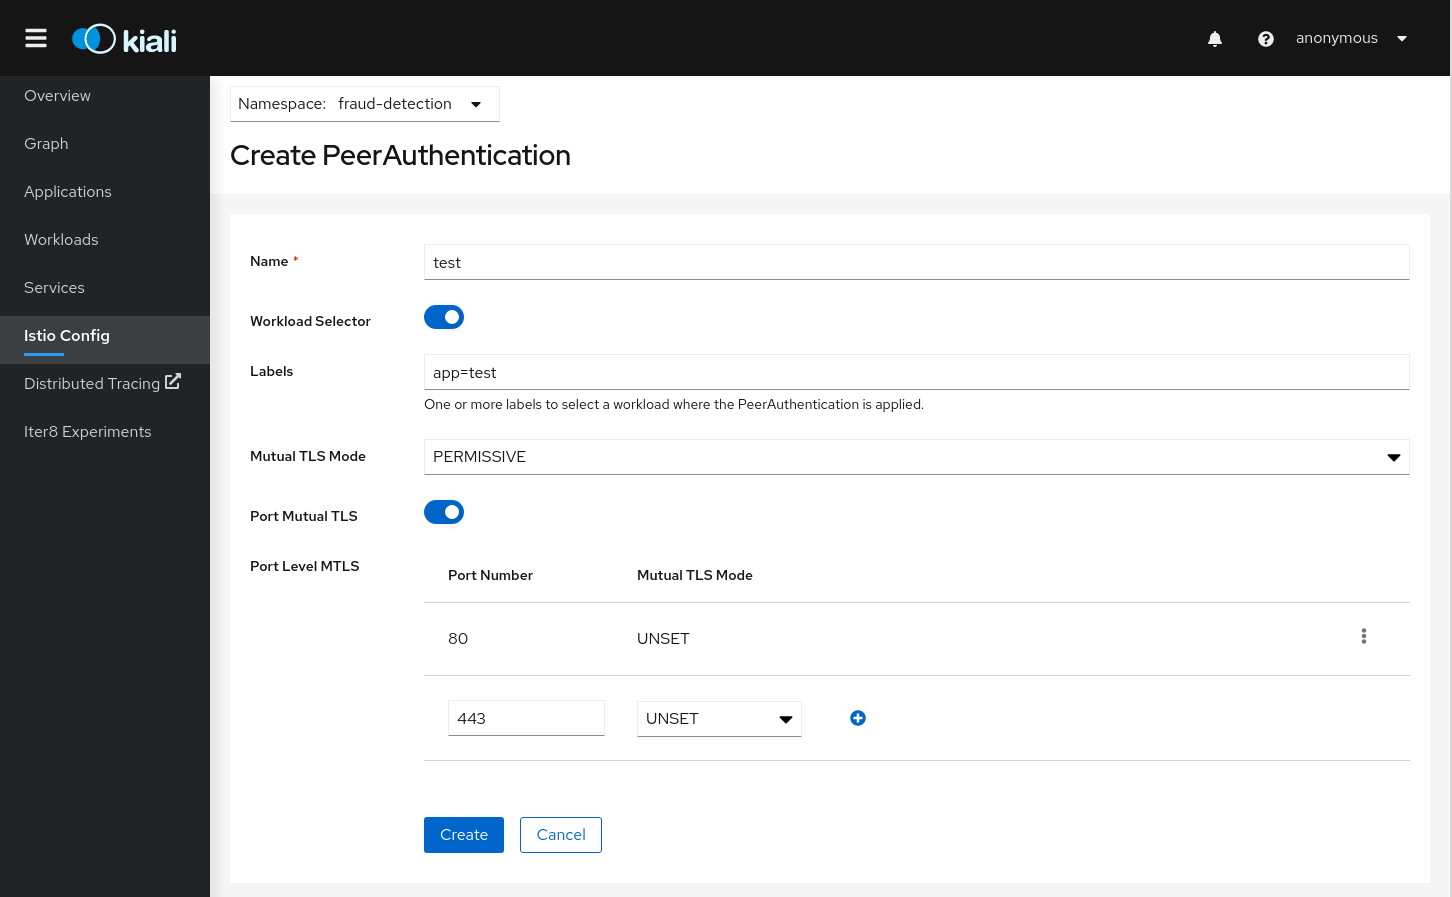
Istio PeerAuthentication resources:
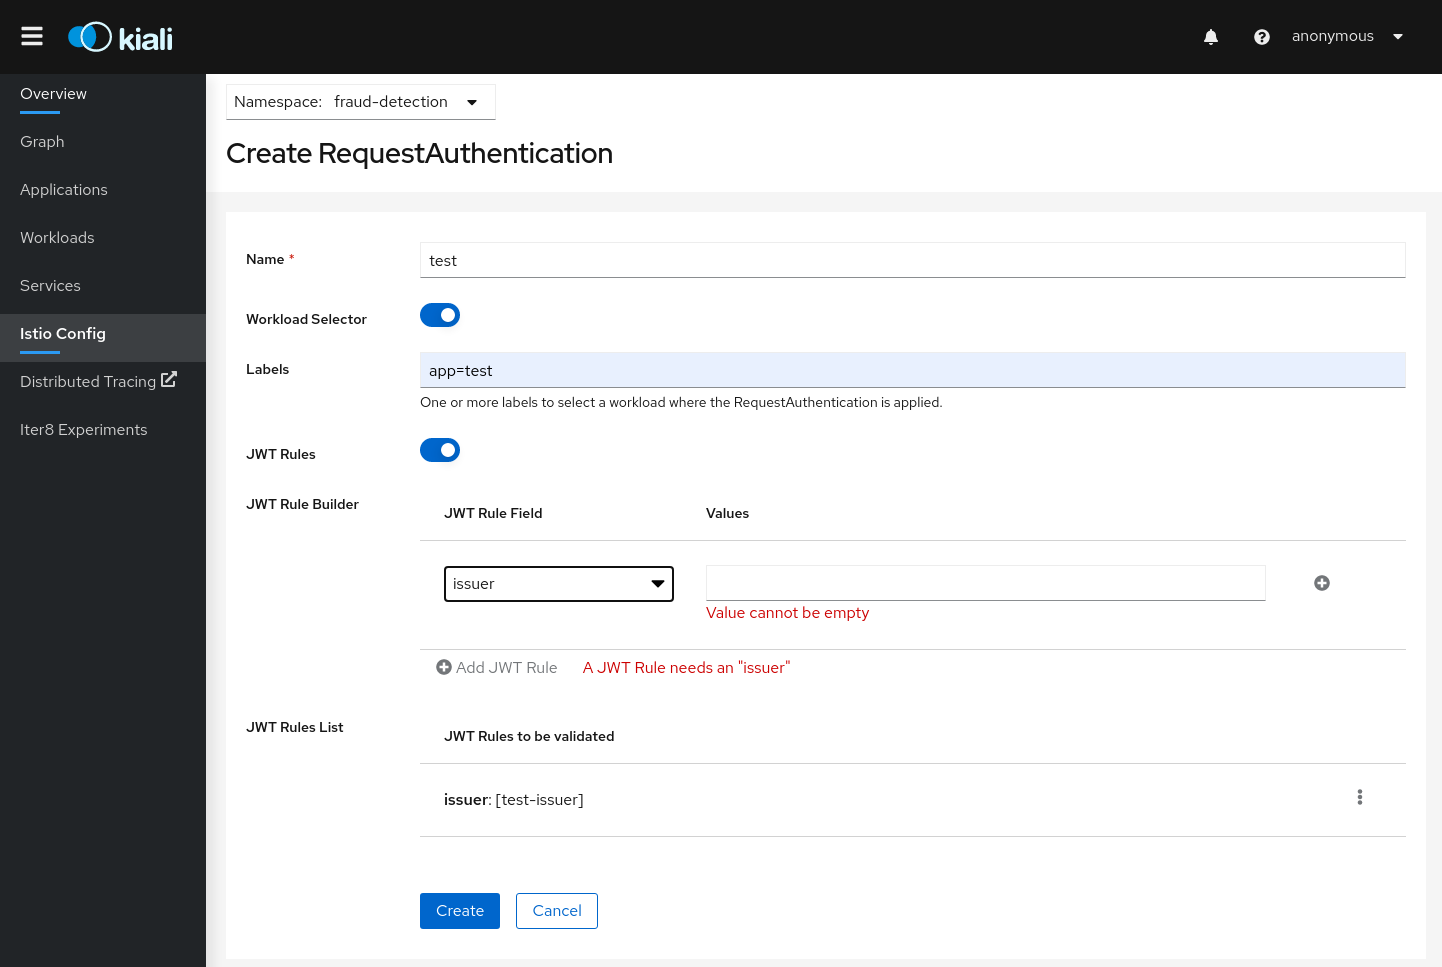
Istio RequestAuthentication resources:
Istio Traffic Forms
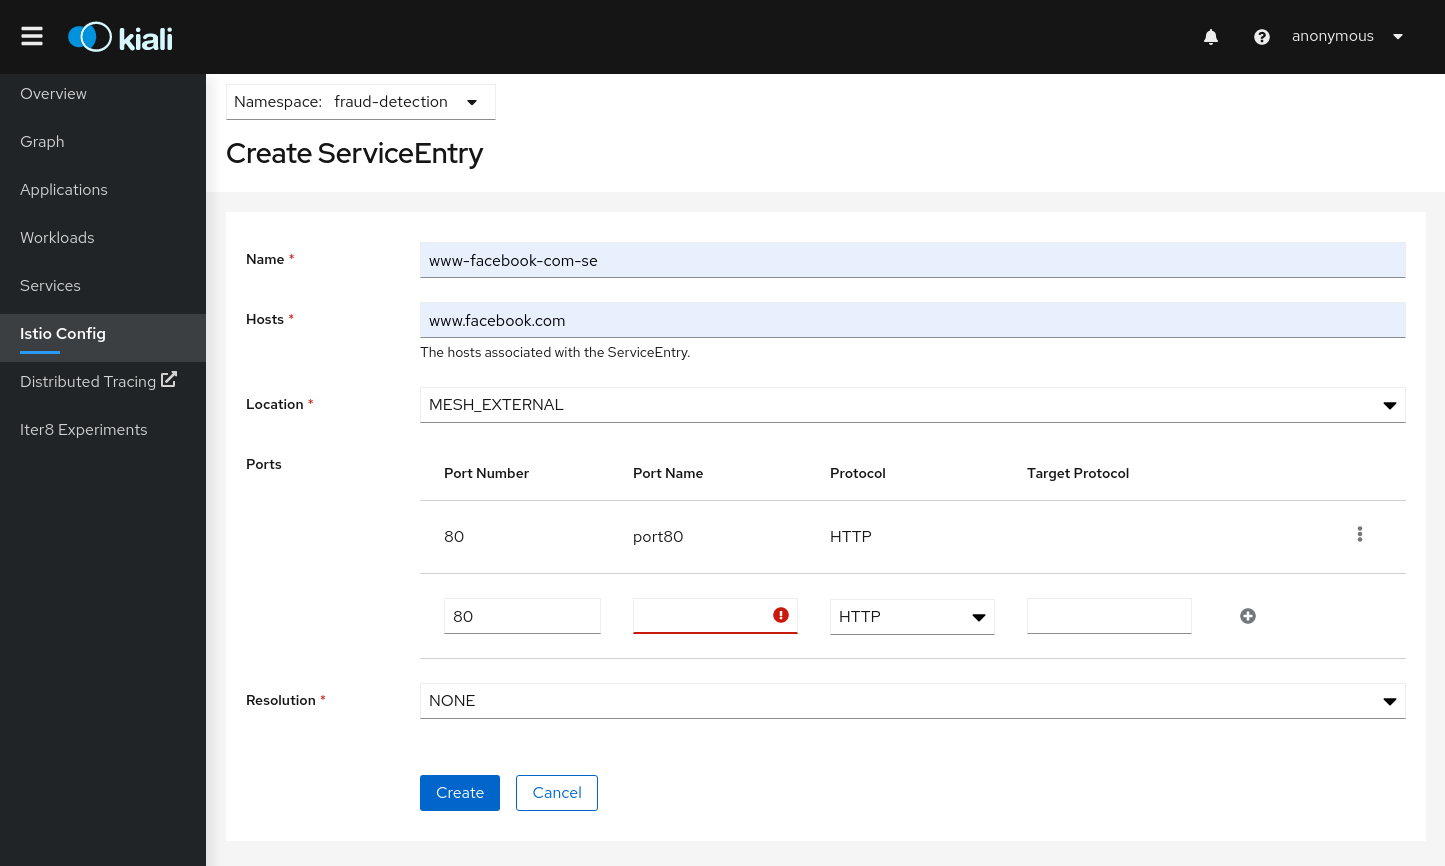
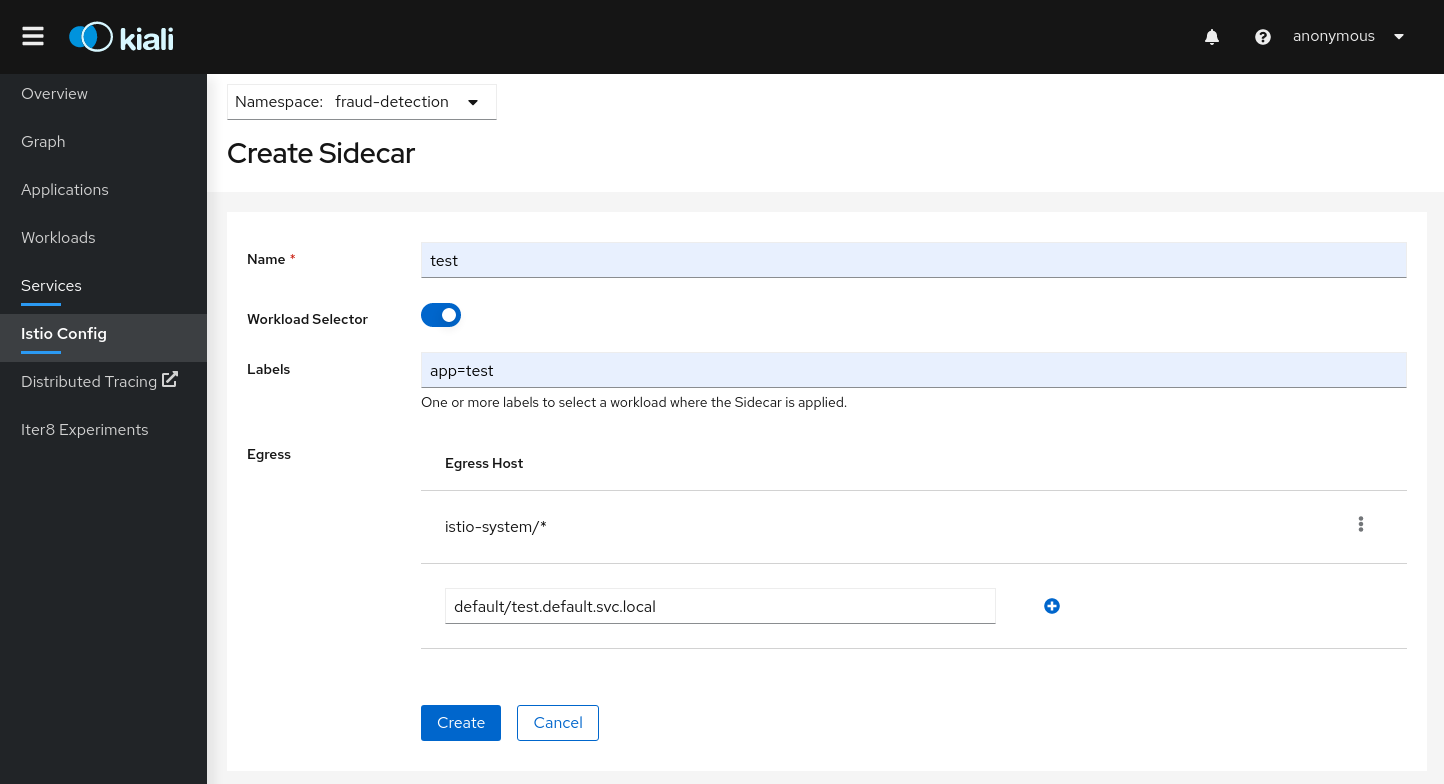
Kiali uses Istio Wizards to generate Istio Traffic config for a specific Service, but Kiali also allows creation of Gateway, ServiceEntry and Sidecar Istio resources for more generic scenarios.
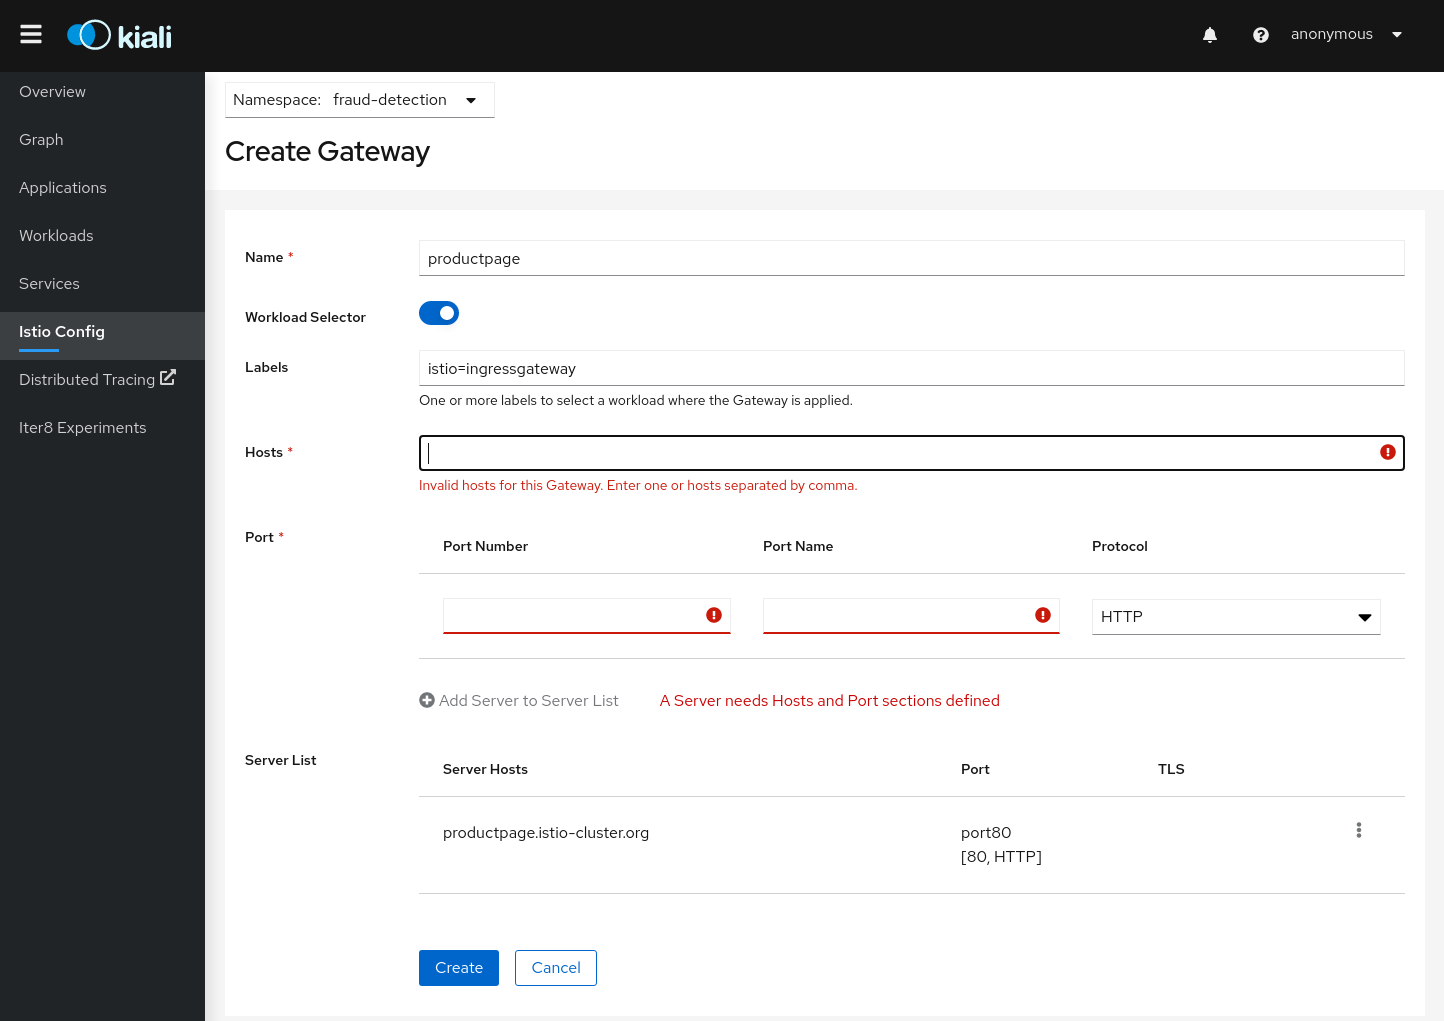
Istio Gateway resources:
Istio ServiceEntry resources:
Istio Sidecar resources:
Health Configuration
Kiali calculates health by combining the individual health of several indicators, such as pods and request traffic. The global health of a resource reflects the most severe health of its indicators.
The table below lists the current health indicators and whether the indicator supports custom configuration for its health calculation.
| Indicator | Supports Configuration |
|---|---|
| Pod Status | No |
| Traffic Health | Yes |
Traffic Health
Kiali establishes reasonable defaults for determining the health of request traffic. But when the defaults are not appropriate Kiali offers a way to customize the thresholding used to determine degraded or failing request traffic for resources (service, workload, app…). See the Health Configuration documentation for more detail.
Security
Kiali gives support to better understand how mTLS is used in Istio meshes. Find those helpers in the graph, the masthead menu, the overview page and specific validations.
Masthead indicator
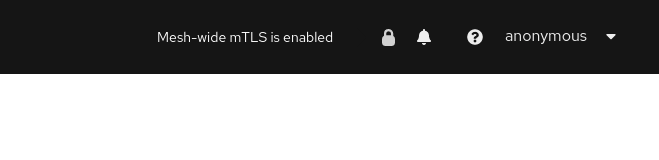
At the right side of the Masthead, Kiali shows a lock when the mesh has strictly enabled mTLS for the whole service mesh. It means that all the communications in the mesh uses mTLS.
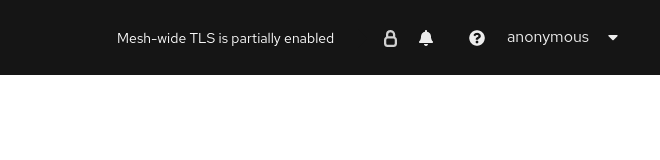
Kiali shows a hollow lock when either the mesh is configured in PERMISSIVE mode or there is a misconfiguration in the mesh-wide mTLS configuration.
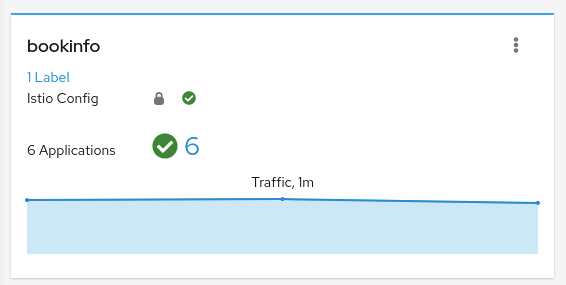
Overview locks
The overview page shows all the available namespaces with aggregated data. Besides the health and validations, Kiali shows also the mTLS status at namespace-wide. Similar to the masthead, it shows a lock when strict mTLS is enabled or a hollow lock when permissive.
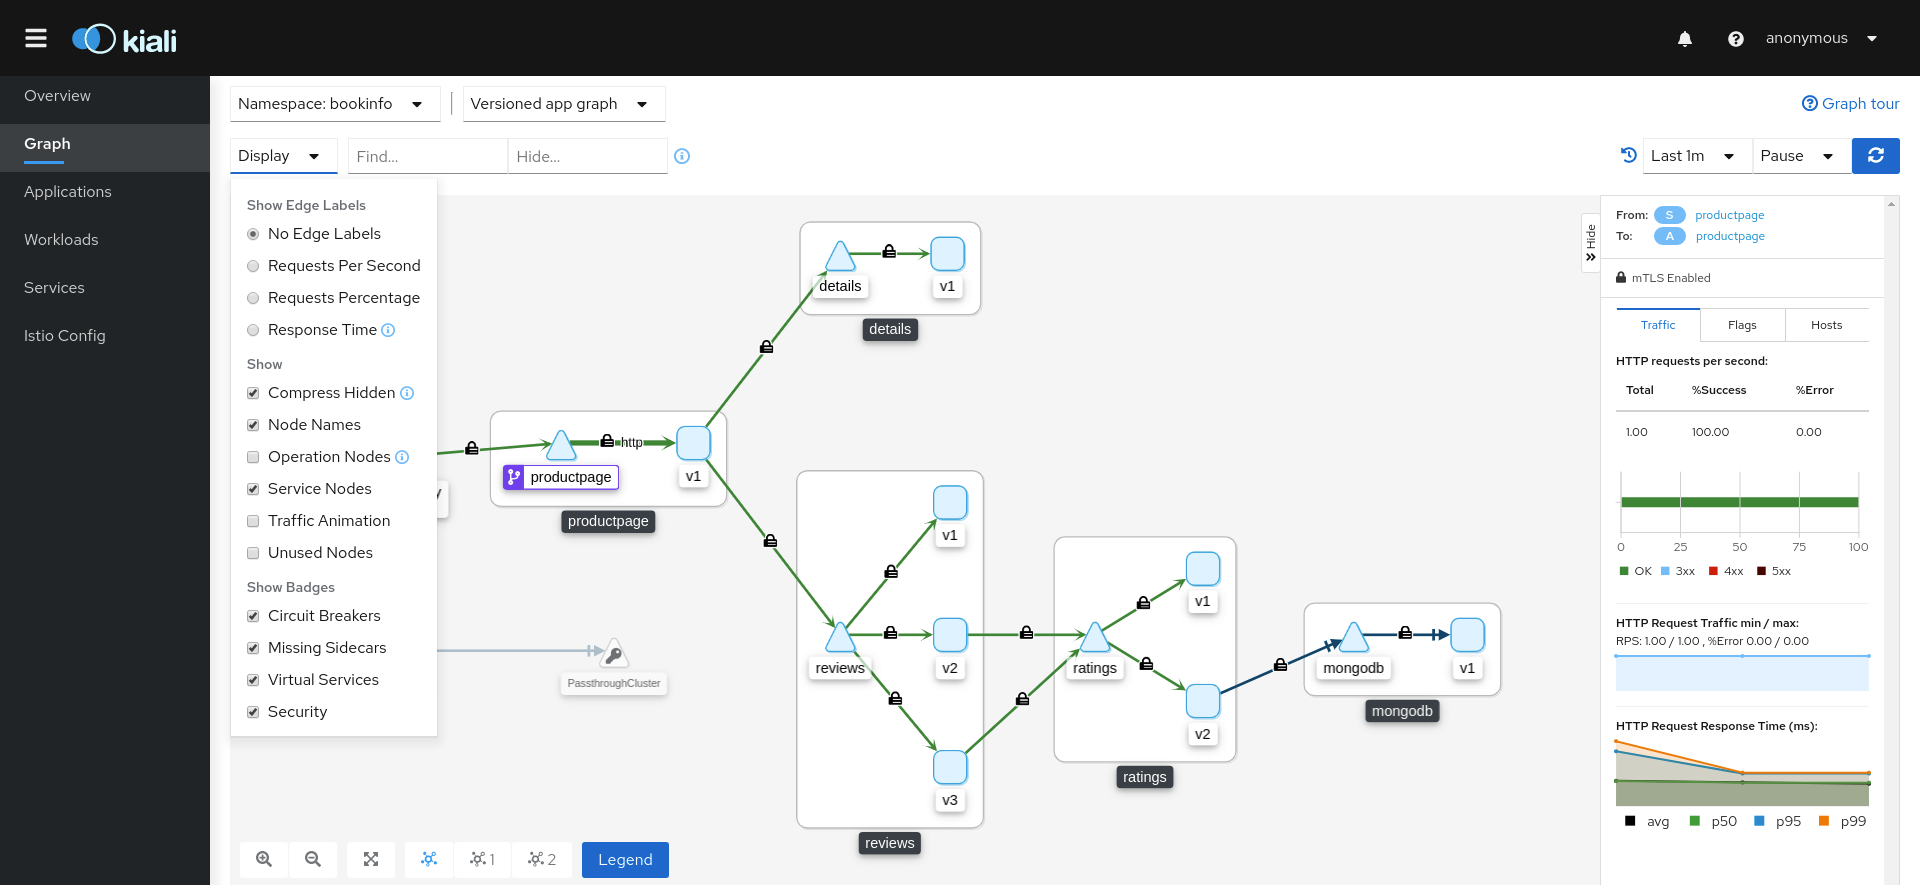
Graph
The mTLS method is used to establish communication between microservices. In the graph, Kiali has the option to show which edges are using mTLS and with what percentatge during the selected period. When an edge shows a lock icon it means at least one request with mTLS enabled is present. In case there are both mTLS and non-mTLS requests, the side-panel will show the percentage of requests using mTLS.
Enable the option in the Display dropdown, select the security badge.
Validations
Kiali has different validations to help troubleshoot configurations related to mTLS such as DestinationRules and PeerAuthentications.
Istio Component Status
The Istio service mesh architecture is comprised of several components, from istiod to Jaeger. Each component must work as expected for the mesh to work well overall. Kiali regularly checks the status of each Istio component to ensure the mesh is healthy.
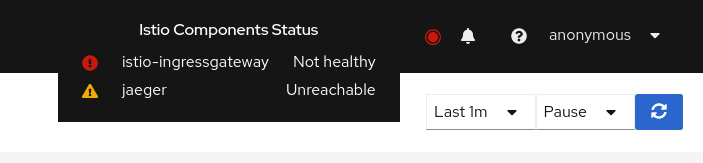
A component status will be one of: Not found, Unreachable, Not healthy and Healthy. The Not found status means that Kiali is not able to find the deployment. The Unreachable status means that Kiali hasn’t been succesfuly able to communicate with the component (Prometheus, Grafana and Jaeger). The Not healthy status means that the deployment doesn’t have the desired amount of replicas running. The Healthy status is when the component is not in the previous ones, plus, healthy components won’t be shown in the list.
Regarding the severity of each component, there are only to options: core or add-on. The core components are those shown as errors (in red) whereas the add-ons are displayed as warnings (in orange).
By default, Kiali checks the following components installed in the control plane namespace: istiod, ingress, egress; and prometheus, grafana and jaeger accessible thought their services.
Advanced Mesh Deployment and Multi-cluster support
A basic Istio mesh deployment has a single control plane with a single data plane, deployed on a single Kubernetes cluster. But Istio supports a variety of advanced deployment models. It allows a mesh to span multiple primary (control plane) and/or remote (data plane only) clusters, and can use a single or multi-network approach. The only strict rule is that within a mesh service names are unique. A non-basic mesh deployment generally involves multiple clusters. See installation instructions for more detail on installing advanced mesh deployments.
Kiali v1.29 introduces experimental support for advanced deployment models. The recommended Kiali deployment model is to deploy an instance of Kiali along with each Istio primary control plane. Each Kiali instance will work as it has in the past, with the configured Kubernetes, Prometheus and Jaeger instances. It will concern itself with the istio config managed by the local primary. But, there are two new additions:
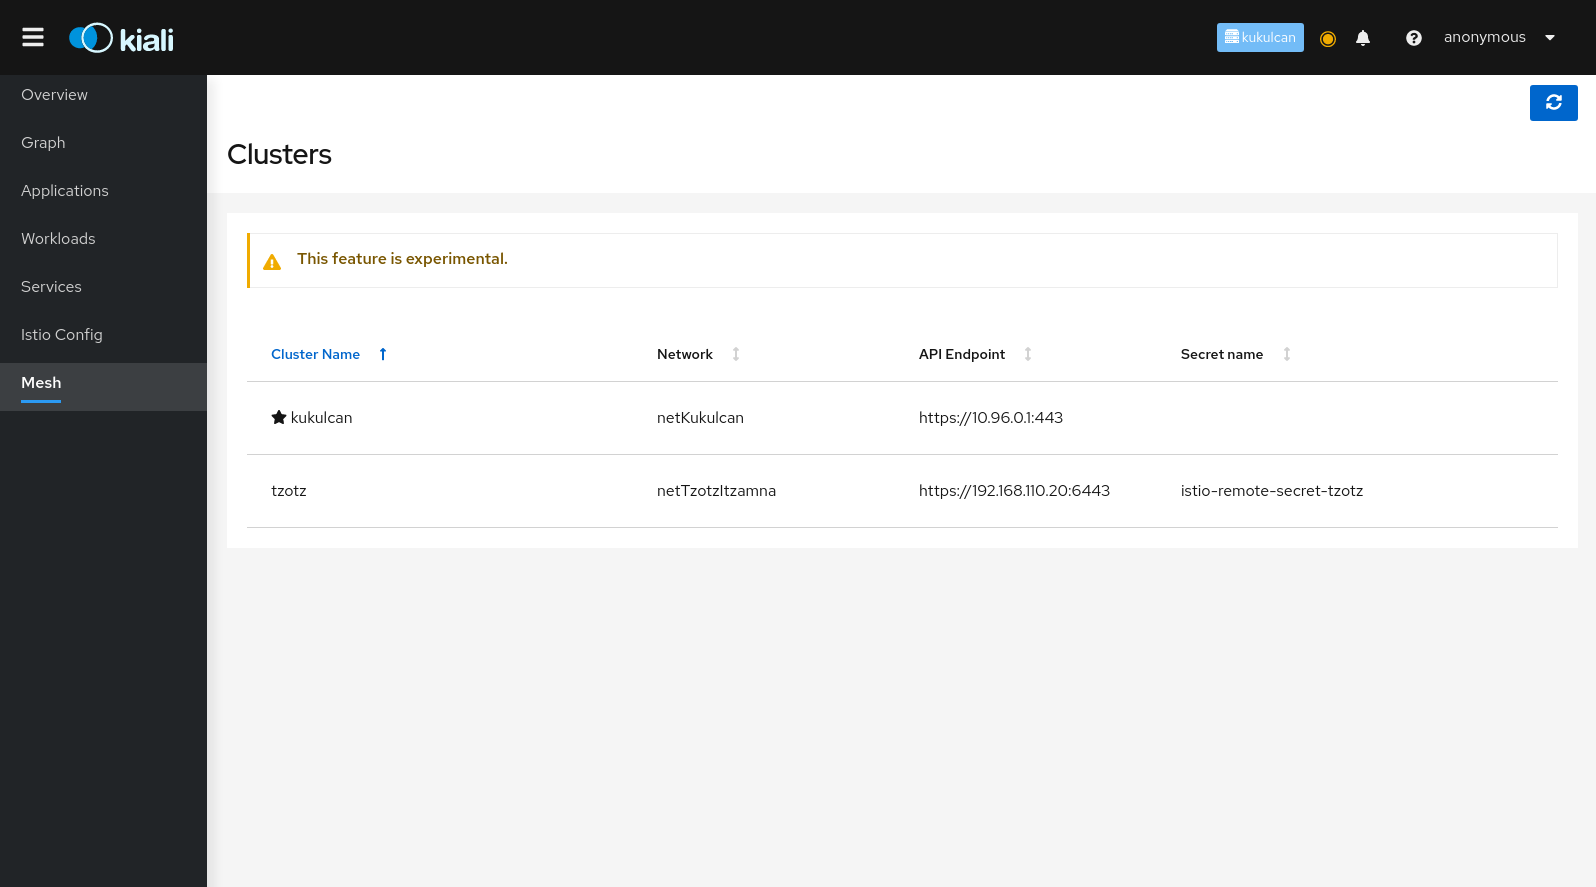
List View: Mesh Discovery
Kiali will attempt to discover the clusters configured in the mesh. And it will identify the home cluster, meaning the cluster on which it is installed and from which it presents its traffic, traces and Istio config. In the following example there are two clusters defined in the mesh, Kukulcan and Tzotz. Kukulcan is identified as the home cluster in three places: the browser tab (not shown), the masthead, and with a star icon in the clusters list:
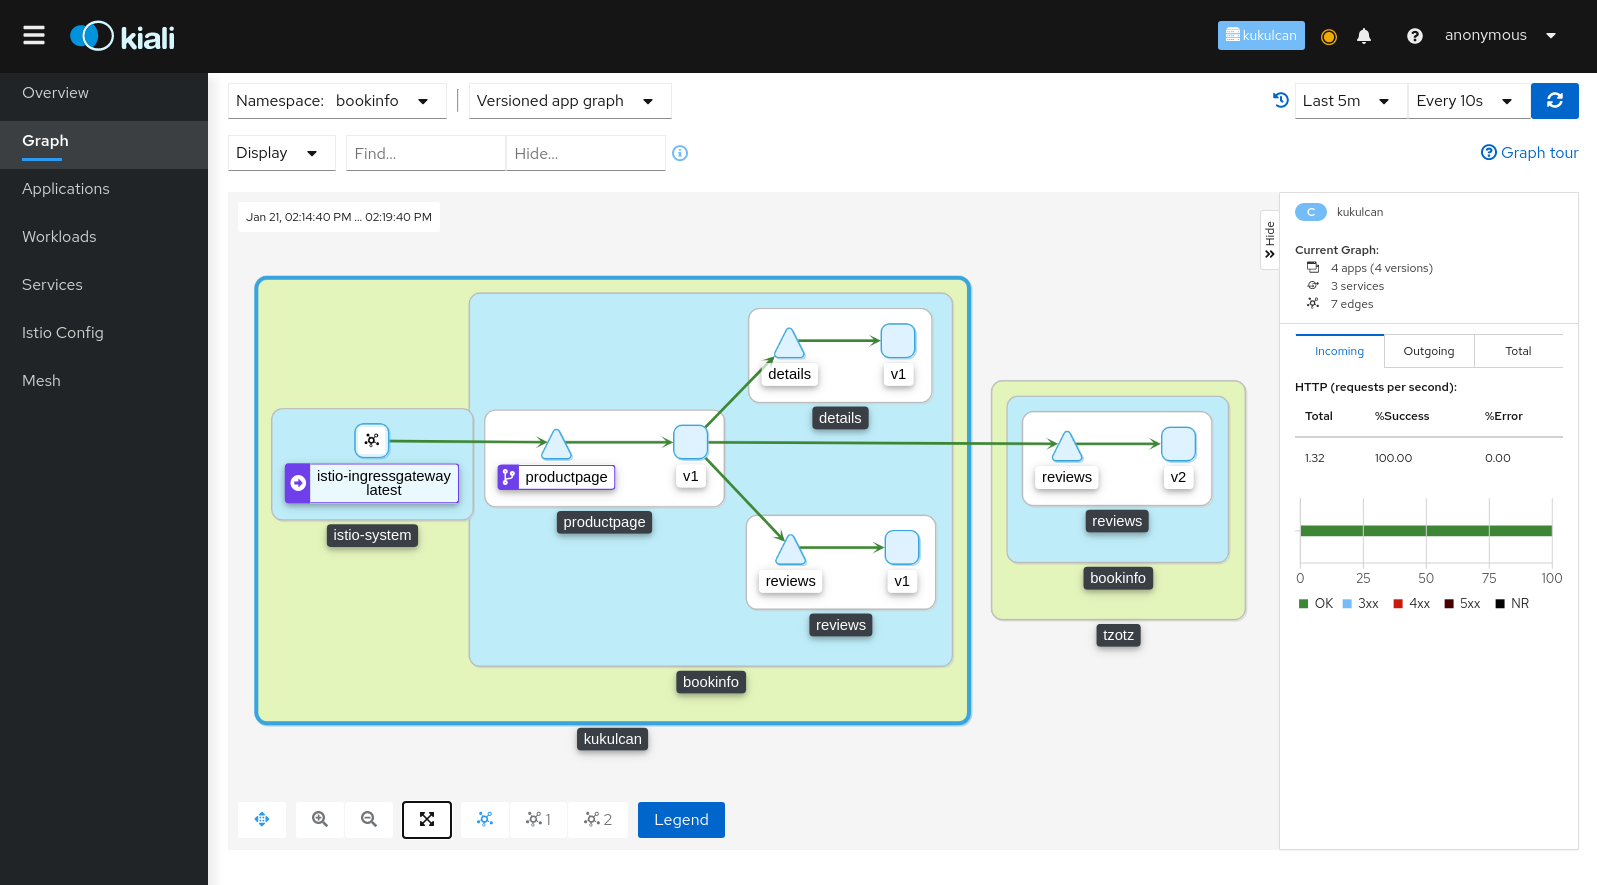
Graph View: Cluster and Namespace Boxing
Starting in v1.8 Istio provides cluster names in the traffic telemetry for multi-cluster installations. The Kiali graph can now use this information to better visualize clusters and namespaces. The Display menu now offers two new options: Cluster Boxes and Namespace Boxes. When enabled, either separately or together, the graph will generate boxes to help more easily identify the relevant nodes and edges, and to see traffic traveling between them.
Each new box type supports selection and will provide a side-panel summary of traffic. Below we see a Bookinfo traffic graph for when Bookinfo services are deployed across the Kukulcan and Tzotz clusters. The Kukulcan cluster box is selected. Because Kukulcan is the Kiali home cluster, you see traffic from the perspective of Kukulcan. Note that you do not see the internal traffic on Tzotz (the requests from Reviews to Ratings service). To see traffic from the Tzotz cluster point of view, you would open a Kiali session on Tzotz, assuming you have privileges.