FAQ
You’ve got questions? We’ve got answers!
- General
-
Graph
- Why is the graph badly laid out?
- Why are there many unknown nodes in the graph?
- Why do I have missing edges?
- Why can't I see traffic leaving the mesh?
- Why my external HTTPS traffic is showing as TCP?
- Why does my workload graph show service nodes?
- Why do I see traffic to PassthroughCluster?
- Why don't I see response times on my service graph?
- Why are my TCP requests disconnected in the graph?
- How do I inspect the underlying metrics used to generate the Kiali Graph?
- Which lock icons should I see when I enable the Kiali Graph Security Display option?
-
Distributed Tracing
- I can't see the tracing features embedded, new tab open when browsing traces
- I can’t see the link to Tracing or traces tab in service details
- I have no Tracing URL in the about modal
- I see an error message in embedded feature "might be temporarily down ..."
- I see the following informative message: "Could not fetch Jaeger info. Turning off Jaeger integration"
- I see the following informative message: "certificate signed by unknown authority"
- Authentication
General
How do I access Kiali UI?
This assumes that you have used the Installation guide to install Kiali.
If you are using OpenShift, installation exposes Kiali through a route. The following command should open Kiali in your default web browser:
xdg-open https://$(oc get routes -n istio-system kiali -o jsonpath='{.spec.host}')/consoleIf you are using Kubernetes, installation exposes Kiali through an
Ingress
rule. Find out your Ingress IP or domain name and use it to access Kiali by
visiting this URL in your web browser:
https://your_ingress_ip_or_domain/kiali.
To find your Ingress IP or domain name, as per the Kubernetes documentation, try the following command (doesn’t work if using Minikube):
kubectl get ingress kiali -n istio-system -o jsonpath='{.status.loadBalancer.ingress[0].ip}'If it doesn’t work, unfortunately, it depends on how and where you had setup your cluster. There are several Ingress controllers available and some cloud providers have their own controller or preferred exposure method. Please, check the documentation of your cloud provider. You may need to customize the pre-installed Ingress rule, or to expose Kiali using a different method.
If you are using Minikube and you have enabled the Ingress controller, the following command should open Kiali in your default web browser:
xdg-open https://$(minikube ip)/kialiIn any platform, you can use port-forwarding to access Kiali. Run any of these commands:
# If you have oc command line tool
oc port-forward svc/kiali 20001:20001 -n istio-system
# If you have kubectl command line tool
kubectl port-forward svc/kiali 20001:20001 -n istio-system
These commands will block. Access Kiali by visiting https://localhost:2001/ in
your preferred web browser.
What is the License?
Kiali uses the Apache License 2.0.
How can I contribute?
Contributions are highly welcome. We look forward to community feedback, additions, and bug reports.
The code repositories are hosted on GitHub. Please see our Contribution Guidelines to learn how to contribute.
In general, we use the GitHub tracker for issues raised by the community, and JIRA for issues raised by the core engineering team. Both are publicly accessible.
Kiali does not work - What do i do?
If you are hitting a problem, whether it is listed here or not, do not hesitate to use the GitHub issue tracker. You can simply vote (using emojis) for any existing bug or feature request, this will help us to understand the most demanded enhancements, or you can create a new ticket. For existing JIRA tickets, use the vote link or add a comment describing your expectation or scenario.
Does Kiali support Internet Explorer?
No version of Internet Explorer is supported with Kiali. Users may experience some issues when using Kiali through this browser.
In order to have the best experience with Kiali you will need to update to use a supported browser.
What are the minimum privileges to login when using RBAC?
The get namespace privilege is required for Kiali login when using an
RBAC-enabled authentication strategy. The user needs the privilege in at least
one namespace. The Kiali Operator will provide a ClusterRole named either
kiali or kiali-viewer with the needed privilege. Users can be bound to
this role.
When using a customized Role or ClusterRole then the following rule is
required for Kiali login:
apiVersion: rbac.authorization.k8s.io/v1
kind: Role
metadata:
  name: custom-kiali-role
rules:
- apiGroups: [""]
  resources:
  - namespaces
  verbs:
  - get
Although required for login, this privilege is not sufficient for Kiali to function well in general.
How can I get in touch?
Graph
Why is the graph badly laid out?
If you search in the mailing list, you will find a number of discussions about the graph layouts.
The layout for Kiali Graph may render differently, depending on the data to display (number of graph nodes and their interactions) and it’s sometimes difficult, not to say impossible, to have a single layout that renders nicely in every situation. That’s why Kiali offers a choice of several layout algorithms. However, we may still find some scenarios where none of the proposed algorithm offer a satisfying display. If Kiali doesn’t render your graph layout in a satisfactory manner please switch to another layout option. This can be done from the Graph Toolbar located on the bottom left of the graph.
If Kiali doesn’t produce a good graph for you, don’t hesitate to open an issue in GitHub or reach us in the mailing lists, and describe your situation.
Why are there many unknown nodes in the graph?
In some situations you can see a lot of connections from an "Unknown" node to your services in the graph, because some software external to your mesh might be periodically pinging or fetching data. This is typically the case when you setup Kubernetes liveness probes, or have some application metrics pushed or exposed to a monitoring system such as Prometheus. Perhaps you wouldn’t like to see these connections because they make the graph harder to read.
From the Graph page, you can filter them out by typing node = unknown in the Graph Hide input box.

For a more definitive solution, there are several ways to prevent Istio from gathering this kind of telemetry.
The first is to have these endpoints (like /health or /metrics) exposed on a different port and server than your main application, and to not declare this port in your Pod's container definition as containerPort. This way, the requests will be completely ignored by the Istio proxy, as mentioned in Istio documentation (at the bottom of that page).
The second way is to modify Istio’s Prometheus rule to explicitly exclude some requests based on the User Agent. This is the Rule resource named promhttp located in istio-system. To edit it:
kubectl edit rule promhttp -n istio-systemor for OpenShift:
oc edit rule promhttp -n istio-systemThen locate the match field under spec section. Change it to filter out, for instance, the Kubernetes probes:
match: (context.protocol == "http" || context.protocol == "grpc") && (match((request.useragent | "-"), "kube-probe*") == false)Note that, starting from Istio 1.1, Kubernetes probes will be filtered out in that way by default. But you may still want to do something equivalent with other User Agents.
Why do I have missing edges?
Kiali builds the graph from Istio’s telemetry. If you don’t see what you expect it probably means that it has not been reported in Prometheus. This usually means that:
1- The requests are not actually sent.
2- Sidecars are missing.
3- Requests are leaving the mesh and are not configured for telemetry.
For example, If you don’t see traffic going from node A to node B, but you are sure there is traffic, the first thing you should be doing is checking the telemetry by querying the metrics, for example, if you know that MyWorkload-v1 is sending requests to ServiceA try looking for metrics of the type:
istio_requests_total{destination_service="ServiceA"}
If telemetry is missing then it may be better to take it up with Istio
Why can't I see traffic leaving the mesh?
See Why do I have missing edges?, and additionally consider:
3- Requests are not configured for telemetry.
You need to create a ServiceEntry (or several) to allow the requests to be mapped correctly.
There are a couple of bugs related to this, one incorrectly maps traffic to other ServiceEntry while the other is about not seeing a ServiceEntry even if is configured correctly.
You can check this article on how to visualize your external traffic in Kiali for more information.
Why my external HTTPS traffic is showing as TCP?
Istio can’t recognize HTTPS requests that go directly to the service, the reason is that these requests are encrypted and are recognized as TCP traffic.
You can however configure your mesh to use TLS origination for your egress traffic. This will allow to see your traffic as HTTP instead of TCP.
Why does my workload graph show service nodes?
Even when Display Service Nodes is disabled a workload graph can show service nodes. Display Service Nodes ensures that you will see the service nodes between two other nodes, providing an edge to the destination service node, and a subsequent edge to the node handling the request. This option injects service nodes where they previously would not be shown. But Kiali will always show a terminal service node when the request itself fails to be routed to a destination workload. This ensures the graph visualizes problem areas. This can happen in a workload or app graph. Of course in a service graph the Display Service Nodes option is simply ignored.
Why do I see traffic to PassthroughCluster?
Requests going to PassthroughCluster (or BlackHoleCluster) are requests that did not get routed to a defined service or service entry, and instead end up at one of these built-in Istio request handlers. See Monitoring Blocked and Passthrough External Service Traffic for more information.
Unexpected routing to these nodes does not indicate a Kiali problem, you’re seeing the actual routing being performed by Istio. In general it is due to a misconfiguration and/or missing Istio sidecar. Less often but possible is an actual issue with the mesh, like a sync issue or evicted pod.
Use Kiali’s Workloads list view to ensure sidecars are not missing. Use Kiali’s Istio Config list view to look for any config validation errors.
Why don't I see response times on my service graph?
Users can select Response Time to label their edges with 95th percentile response times. The response time indicates the amount of time it took for the destination workload to handle the request. In the Kiali graph the edges leading to service nodes represent the request itself, in other words, the routing. Kiali can show the request rate for a service but response time is not applicable to be shown on the incoming edge. Only edges to app, workload, or service entry nodes show response time because only those nodes represent the actual work done to handle the request. This is why a Service graph will typically not show any response time information, even when the Response Time option is selected.
Because Service graphs can show Service Entry nodes the Response Time option is still a valid choice. Edges to Service Entry nodes represent externally handled requests, which do report the response time for the external handling.
Why are my TCP requests disconnected in the graph?
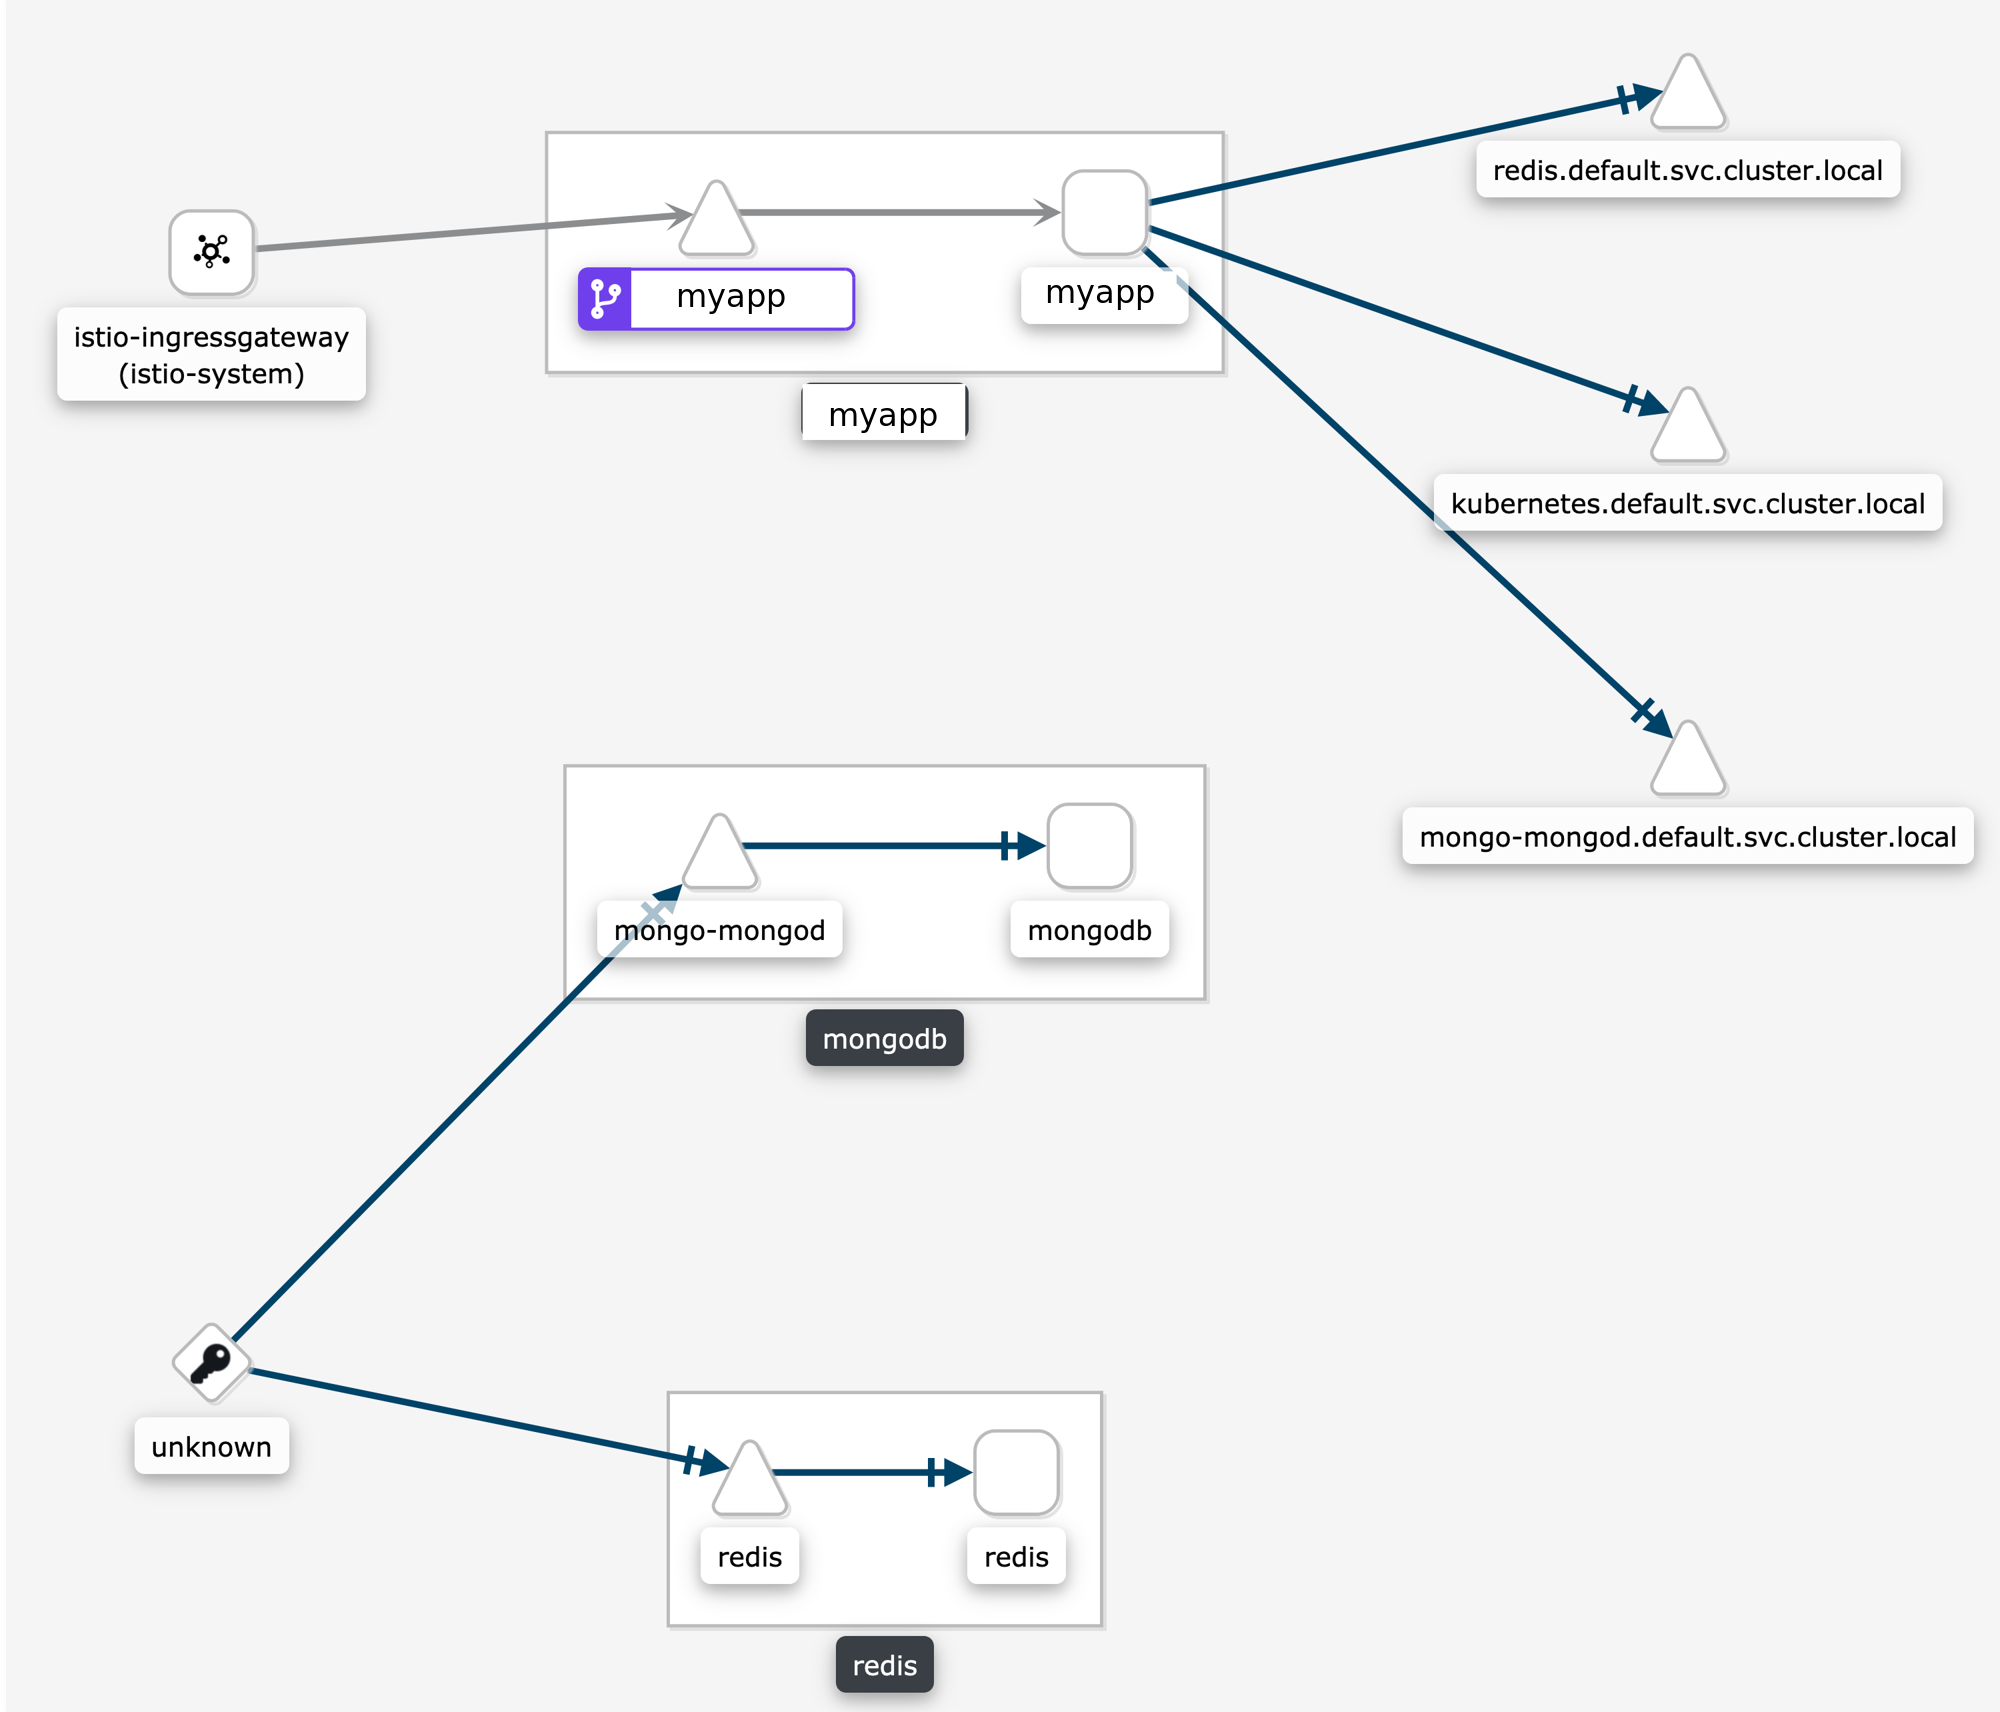
Some users are surprised when requests are not connected in the graph. This is normal Istio telemetry for TCP requests if mTLS is not enabled. For HTTP requests, the requests will be connected even without MTLS, because Istio uses headers to exchange workload metadata between source and destination. With the disconnected telemetry you will see an edge from a workload to a terminal service node. That’s the first hop. And then another edge from "Unknown" to the expected destination service/workload. In the graph below, this can be seen for the requests from myapp to redis and mongodb:
How do I inspect the underlying metrics used to generate the Kiali Graph?
It is not uncommon for the Kiali graph to show traffic that surprises the user. Often the thought is that Kiali may have a bug. But in general Kiali is just visualizing the metrics generated by Istio. The next thought is that the Istio telemetry generation may have a bug. But in general Istio is generating the expected metrics given the defined configuration for the application.
To determine whether there is an actual bug it can be useful to look directly at the metrics collected by and stored in the Prometheus database. Prometheus provides a basic console that can be opened using the istioctl dashboard command:
> istioctl dashboard prometheusThe above command, assuming Istio and Prometheus are in the default istio-system namespace, should open the Prometheus console in your browser.
Kiali uses a variety of metrics but the primary request traffic metrics for graph generation are these:
-
istio_requests_total
-
istio_tcp_sent_bytes_total
The Prometheus query language is very rich but a few basic queries is often enough to gather time-series of interest.
Here is a query that returns time-series for HTTP or GRPC requests to the reviews service in Istio’s BookInfo sample demo:
istio_requests_total{reporter="source", destination_service_name="reviews"}
And here is an example of the results:
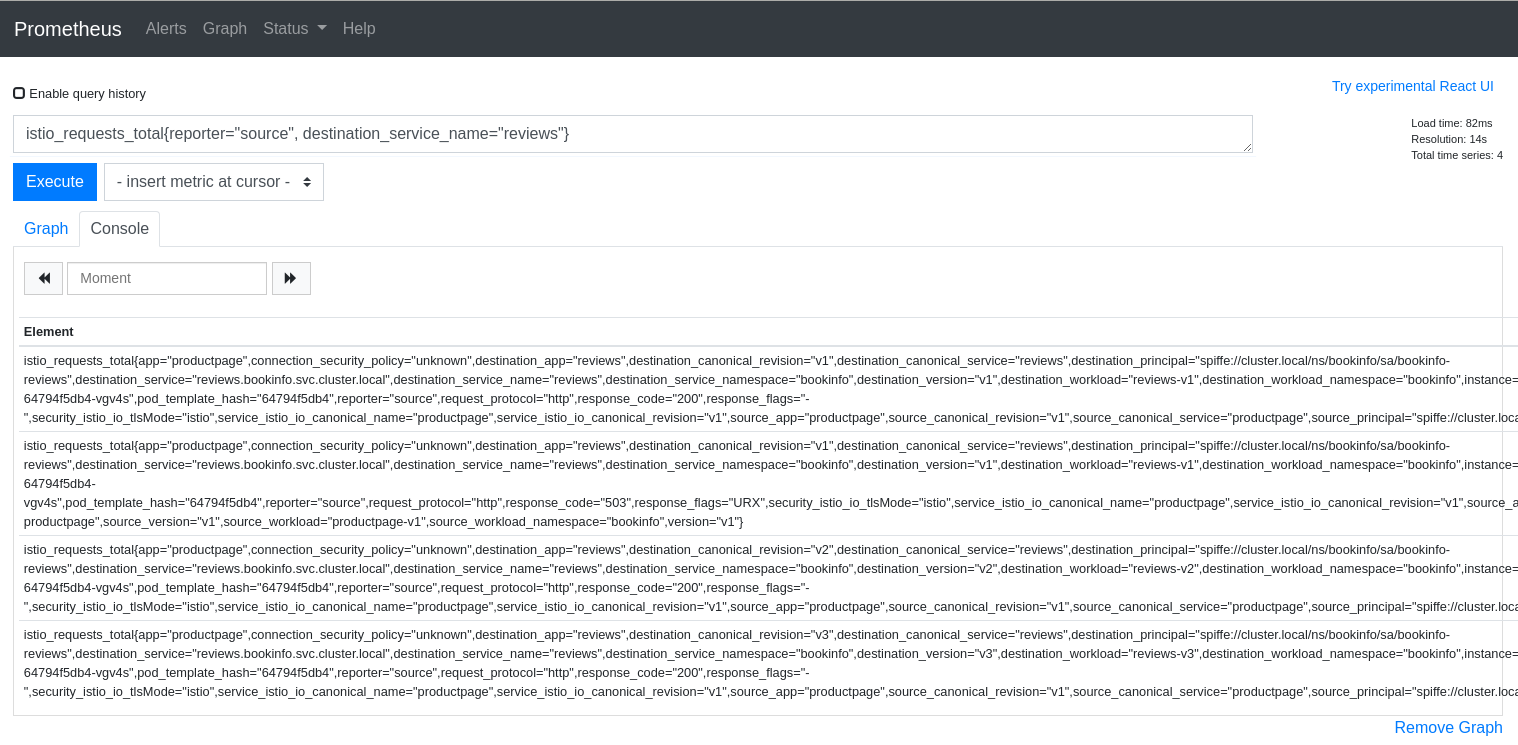
The query above is good for dumping all of the attributes but it can be useful to aggregate results by desired attributes. The next query will get the request counts for the reviews service broken down by source and destination workloads:
sum(istio_requests_total{reporter="source", destination_service_name="reviews"}) by (source_workload, destination_workload)
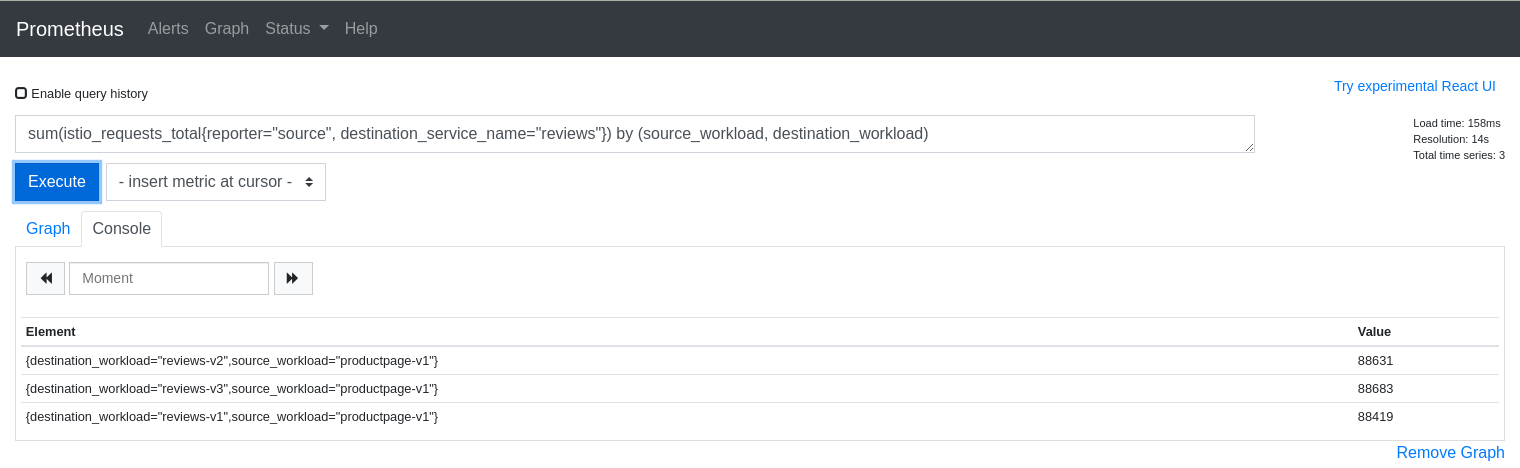
The first step to explaining your Kiali graph is to inspect the metrics used to generate the graph. Kiali devs may ask for this info when working with you to solve a problem, so it is useful to know how to get to the Prometheus console.
Which lock icons should I see when I enable the Kiali Graph Security Display option?
Sometimes the Kiali Graph Security Display option causes confusion. The option is disabled by default for optimal performance, but enabling the option typically adds nominal time to the graph rendering. When enabled, Kiali will determine the percentage of mutual TLS (mTLS) traffic on each edge. Kiali only shows lock icons on edges with traffic that differs from the global setting for the time period. If global MTLS is configured Kiali will show a lock icon in the masthead and open lock icons on edges with less than 100% mTLS traffic. Otherwise Kiali will not show the masthead lock icon and shows closed lock icons for edges that have > 0% mTLS traffic.
Kiali determines the mTLS percentage for the edges via the connection_security_policy attribute in the
Prometheus telemetry. Note that this is destination telemetry (i.e. reporter="destination").
For more on the masthead indicator, the graph security option, and other Kiali security features see Security Features.
Distributed Tracing
I can't see the tracing features embedded, new tab open when browsing traces
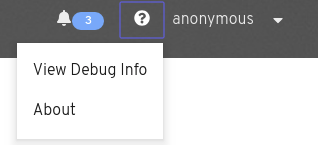
The Distributed Tracing item in the main menu opens a new tab when Kiali and Jaeger services are deployed under the same URI scheme (HTTP/HTTPS). In order to enable the integration, make both services run either under HTTP or HTTPS. To see which is the tracing URL Kiali uses, check the about modal like the FAQ 2.
I can’t see the link to Tracing or traces tab in service details
To see Jaeger integration (both link to browse traces and traces tabs in service details) Kiali needs to know the URL where Jaeger is running under. In order for Kiali users to know which URL Kiali users, check the About menu, as it follows:

I have no Tracing URL in the about modal
Kiali didn’t find the tracing service. Kiali tries to search for the tracing service in tracing or jaeger-query. If you have another name for this service you must set the values in the yaml configuration when installed with Kiali Operator
# **Tracing-specific settings:
#  - Right now we only support Jaeger
# namespace: The Kubernetes namespace that holds the Tracing service (if empty, assumes the same value as deployment.namespace)
# service: The Kubernetes service name for tracing. Kiali uses this to connect within the cluster to Jaeger.
# url: The URL that Kiali uses when integrating with Tracing. This URL must be accessible to clients external to
#      the cluster in order for the integration to work properly. If empty, an attempt to auto-discover it is made.
#    ---
#    tracing:
#      namespace: ""
#      service : ""
#      url: ""
I see an error message in embedded feature "might be temporarily down ..."
If you are working in a development environment, you can see an error as the image below.
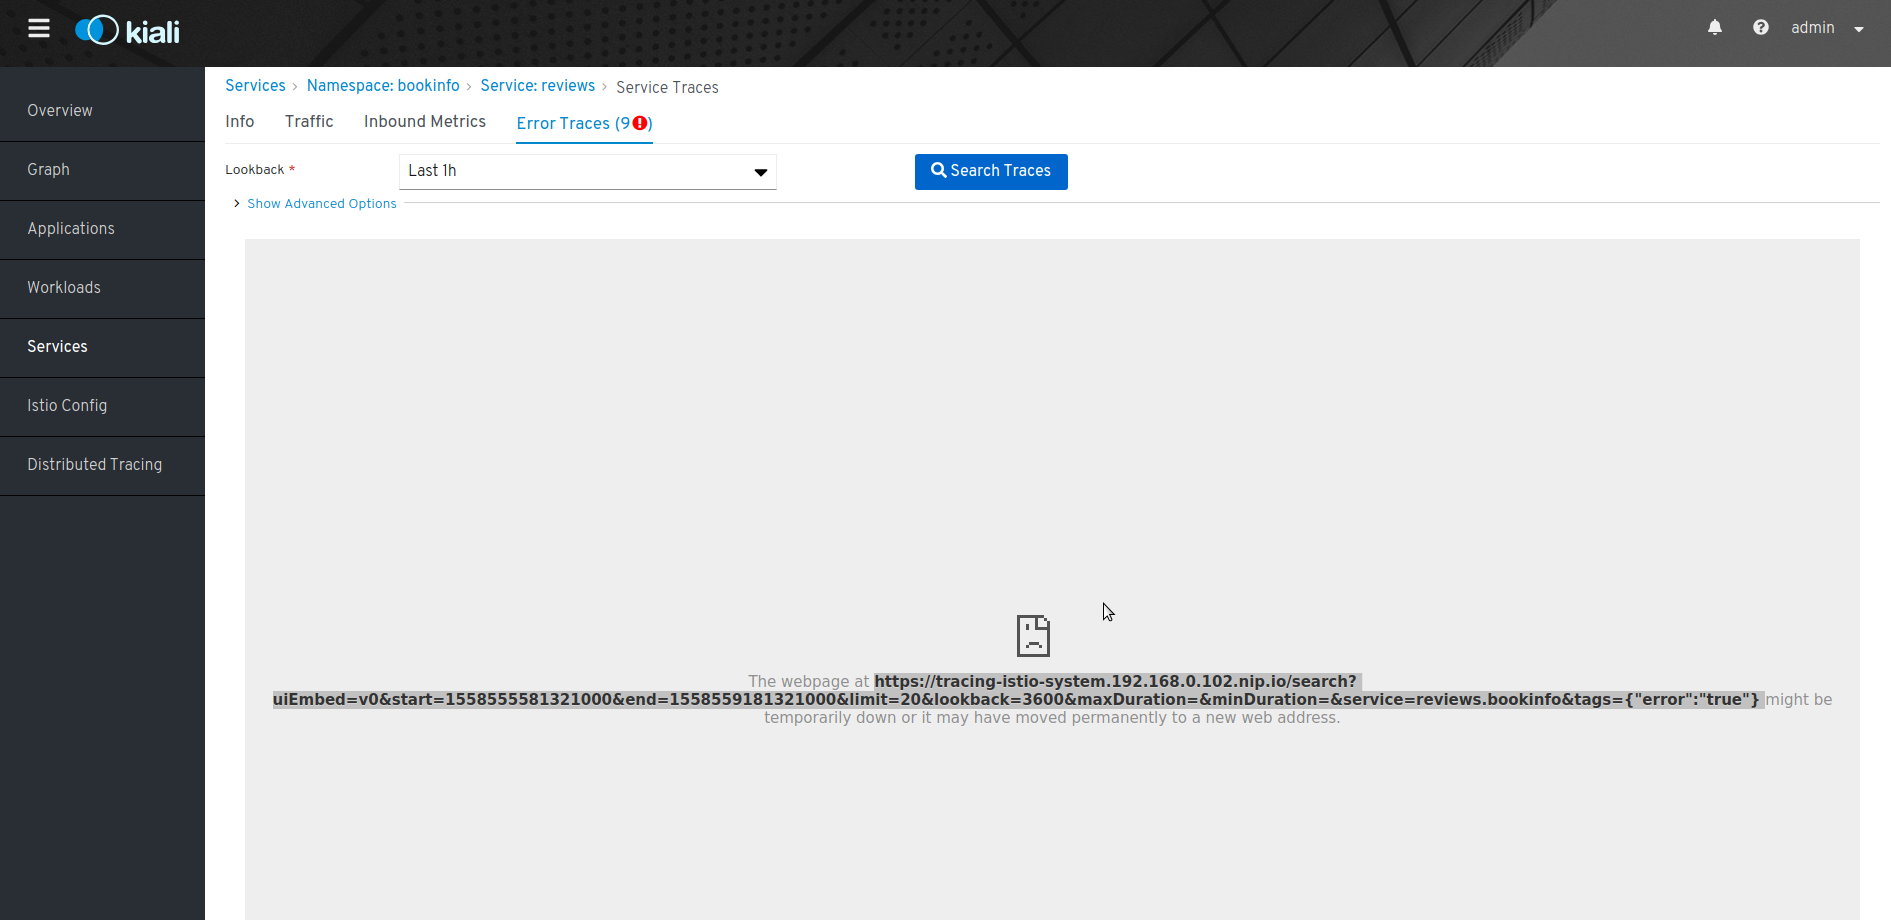
This is because your certificate is not valid, so you need to accept the certificate, open the tracing service in a new tab and accept it, after that you need to refresh the Kiali website.
I see the following informative message: "Could not fetch Jaeger info. Turning off Jaeger integration"
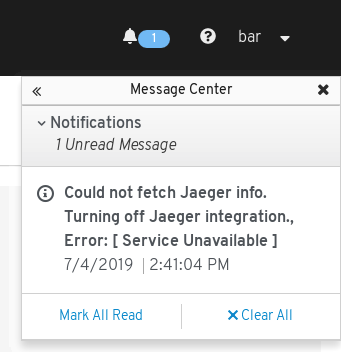
Although Kiali discovered the Jaeger URL the signed up user doesn’t have access to the Jaeger query endpoint. Accessing to the discovered URL (shown in the "About" modal) shouldn’t be working. Once the endpoint will be accessible by the signed up user, the Jaeger integration will be enabled in Kiali.
I see the following informative message: "certificate signed by unknown authority"
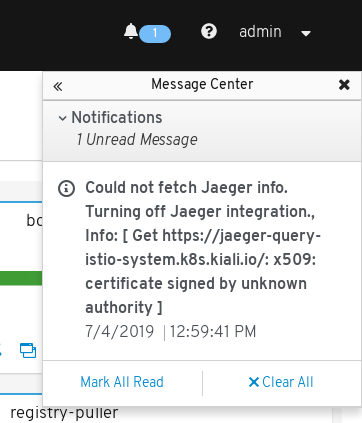
In order to Kiali enable Jaeger integration, Kiali needs to check the availability of the discovered URL. If that URL uses TLS and the certificate is signed by an untrusted authority, then Kiali can’t establish connection with it for security purposes. However there is a workaround for that. Kiali can be configured to skip the authority verification through the flag: insecure_skip_verify. Change its value to true in the Kiali CR.
Validations
Which formats does Kiali support for specifying hosts?
Istio highly recommends that you always use fully qualified domain names (FQDN) for hosts in DestinationRules. However, Istio does allow you to use other formats like short names (details or details.bookinfo). Kiali only supports FQDN and simple service names as host formats: for example details.bookinfo.svc.cluster.local or details. Validations using the details.bookinfo format might not be accurate.
In the following example it should show the validation of "More than one Destination Rule for the same host subset combination". Because of the usage of the short name reviews.bookinfo Kiali won’t show the warning message on both destination rules.
apiVersion: networking.istio.io/v1alpha3
kind: DestinationRule
metadata:
  name: reviews-dr1
  namespace: bookinfo
spec:
  host: reviews
  subsets:
  - name: v1
    labels:
      version: v1
  - name: v2
    labels:
      version: v2
---
apiVersion: networking.istio.io/v1alpha3
kind: DestinationRule
metadata:
  name: reviews-dr2
  namespace: bookinfo
spec:
  host: reviews.bookinfo
  trafficPolicy:
    loadBalancer:
      simple: RANDOM
  subsets:
  - name: v1
    labels:
      version: v1
See the recomendation Istio gives regarding host format: "To avoid potential misconfigurations, it is recommended to always use fully qualified domain names over short names."
For best results with Kiali, you should use fully qualified domain names when specifying hosts.
Authentication
How to obtain a token when logging in via token auth strategy
When configuring Kiali to use the token auth strategy, it requires users to log into Kiali as a specific user via the user’s service account token. Thus, in order to log into Kiali you must provide a valid Kubernetes token.
You can extract a service account’s token from the secret that was created for you when you created the service account.
For example, if you want to log into Kiali using Kiali’s own service account, you can get the token like this:
kubectl get secret -n istio-system $(kubectl get sa kiali-service-account -n istio-system -o jsonpath={.secrets[0].name}) -o jsonpath={.data.token} | base64 -dNote that this example assumes you installed Kiali in the istio-system namespace.
Once you obtain the token, you can go to the Kiali login page and copy-and-paste that token into the token field. At this point, you have logged into Kiali with the same permissions as that of the Kiali server itself (note: this gives the user the permission to see everything).
Create different service accounts with different permissions for your users to use. Each user should only have access to their own service accounts and tokens.
How to configure the originating port when Kiali is served behind a proxy (OpenID support)
When using OpenID strategy for authentication and deploying Kiali behind a reverse proxy or a load balancer, Kiali needs to know the originating port of client requests. You may need to setup your proxy to inject a X-Forwarded-Port HTTP header when forwarding the request to Kiali.
For example, when using an Istio Gateway and VirtualService to expose Kiali, you could use the headers property of the route:
spec:
  gateways:
  - istio-ingressgateway.istio-system.svc.cluster.local
  hosts:
  - kiali.abccorp.net
  http:
  - headers:
      request:
        set:
          X-Forwarded-Port: "443"
    route:
    - destination:
        host: kiali
        port:
          number: 20001