Features
Overview
Kiali helps you define, validate, and observe the connections and microservices of your Istio service mesh.
Kiali works with Istio in OpenShift or Kubernetes. It visualizes the service mesh topology and provides visibility into features like request routing, circuit breakers, request rates, latency and more. Kiali offers insights about the mesh components at different levels, from abstract Applications to Services and Workloads.
Kiali also includes Jaeger Tracing to provide distributed tracing by default.
Observability Features
The following observability features help you ensure your mesh is healthy or to quickly identify problem areas in operation. It combines topology, telemetry, traces, logs, events and definitions in a holistic view of your system.
Graph
The graph provides a powerful way to visualize the topology of your service mesh. It shows you which services communicate with each other and the traffic rates and latencies between them, which helps you visually identify problem areas and quickly pinpoint issues. Kiali provides graphs that show a high-level view of service interactions, a low level view of workloads, or a logical view of applications.
The graph also shows which services are configured with virtual services and circuit breakers. It identifies security issues by identifying traffic not configured as expected. You can observe the traffic flow between components by watching the animation or viewing the metrics.
You can configure the graph to show the namespaces and data that are important to you, and display it in the way that best meets your needs.

Graph: Health
Colors in the graph represent the health of your service mesh. A node colored red or orange might need attention. The color of an edge between components represents the health of the requests between those components. The node shape indicates the type of component such as services, workloads, or apps.
The health of nodes and edges is refreshed automatically based on the user’s preference. The graph can also be paused to examine a particular state.
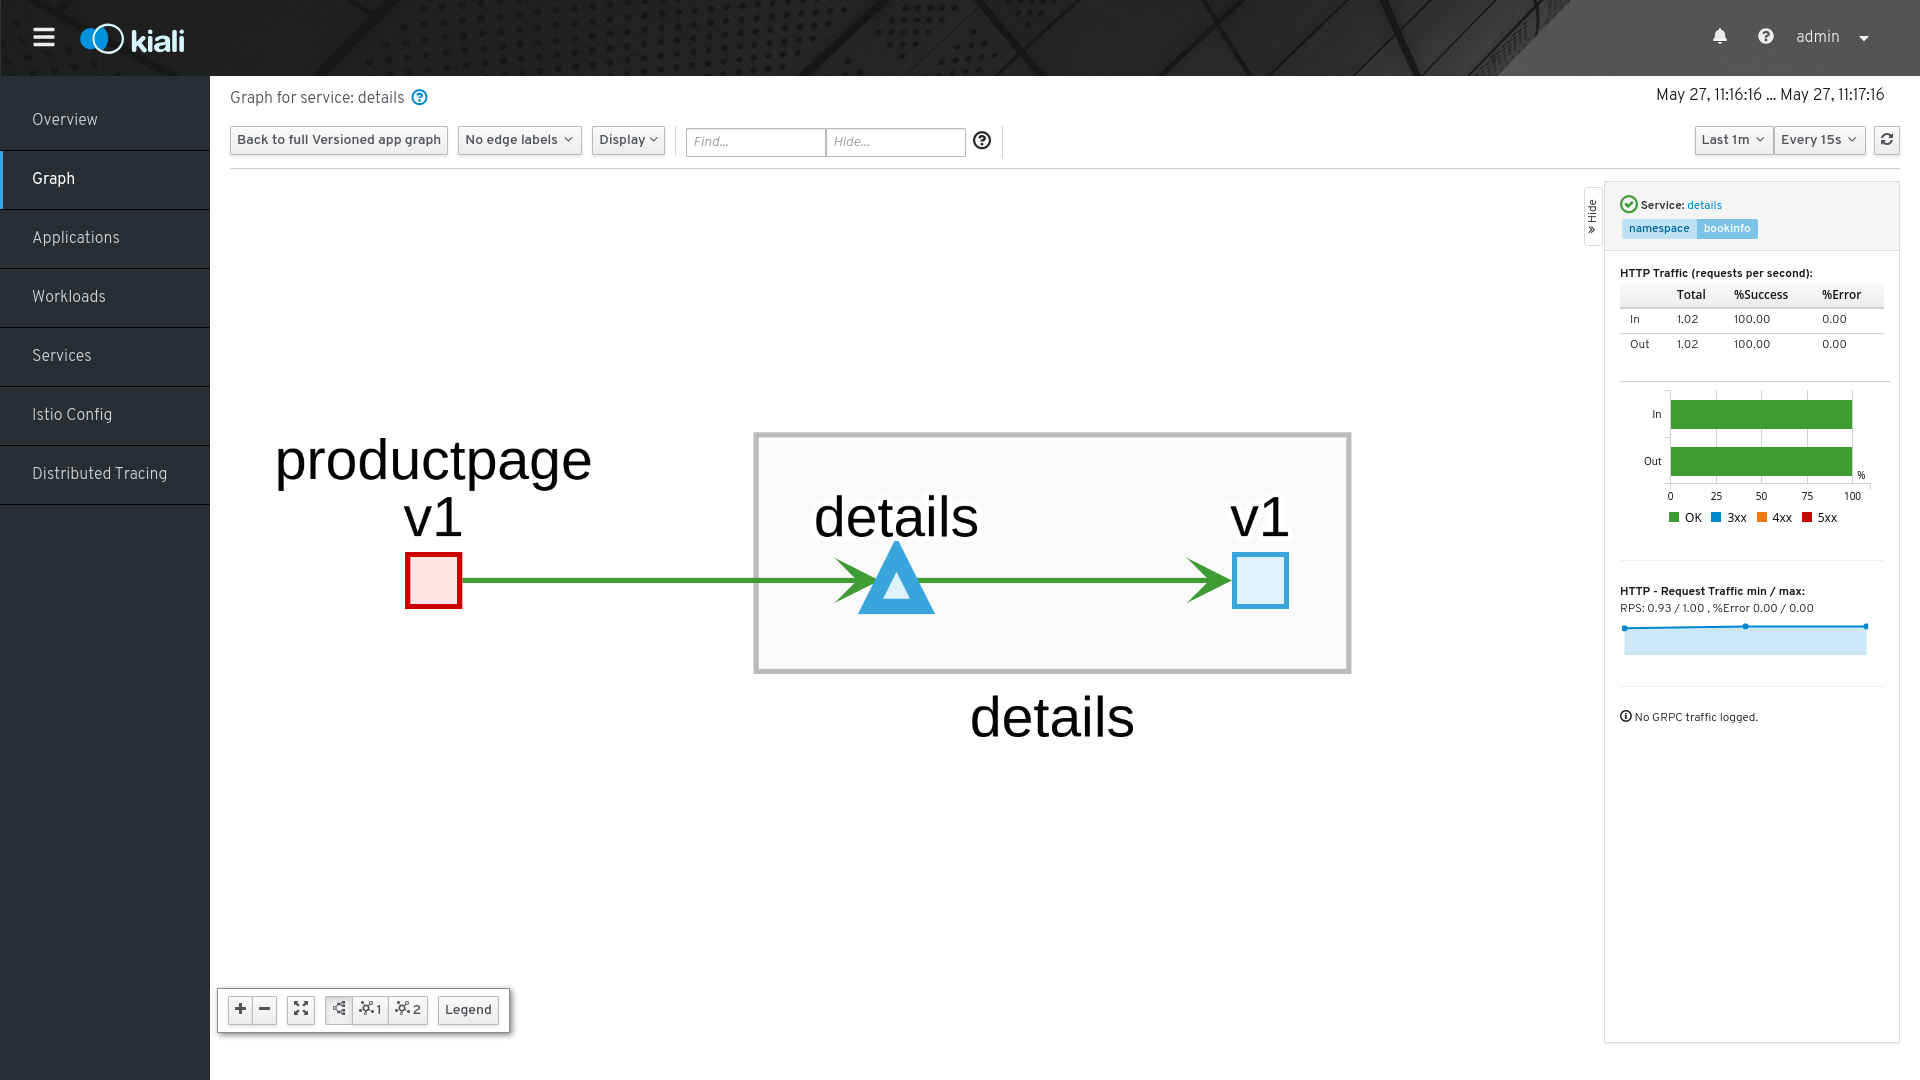
Graph: Drill-Down
You can focus the app graph on just one component, whether it’s a service, a workload, or an application. Kiali offers detail graphs for any component you choose.
Double click on a graph node and you can see a detailed view centered on that component. It shows you only the incoming requests being served and the outgoing requests being made - all from the point-of-view of that component’s telemetry.
You can jump back to the main graph and continue where you left off.
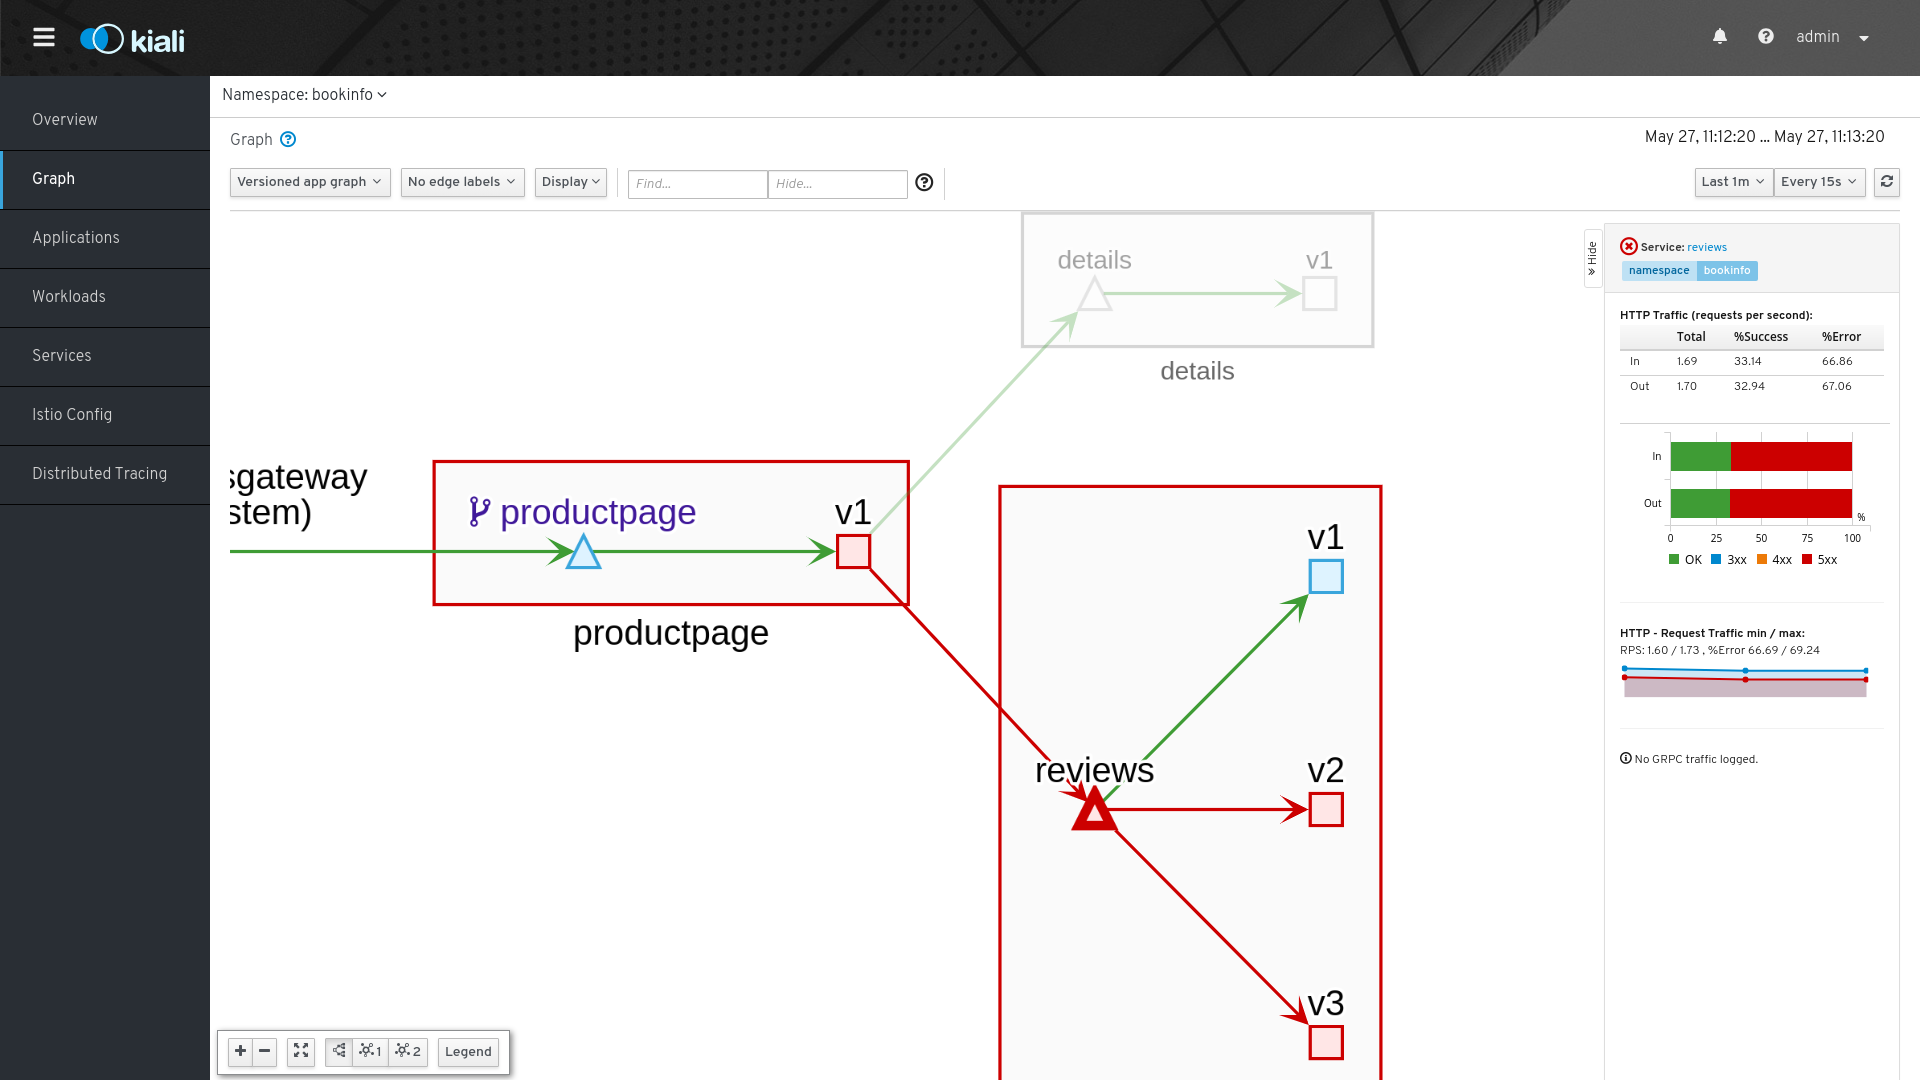
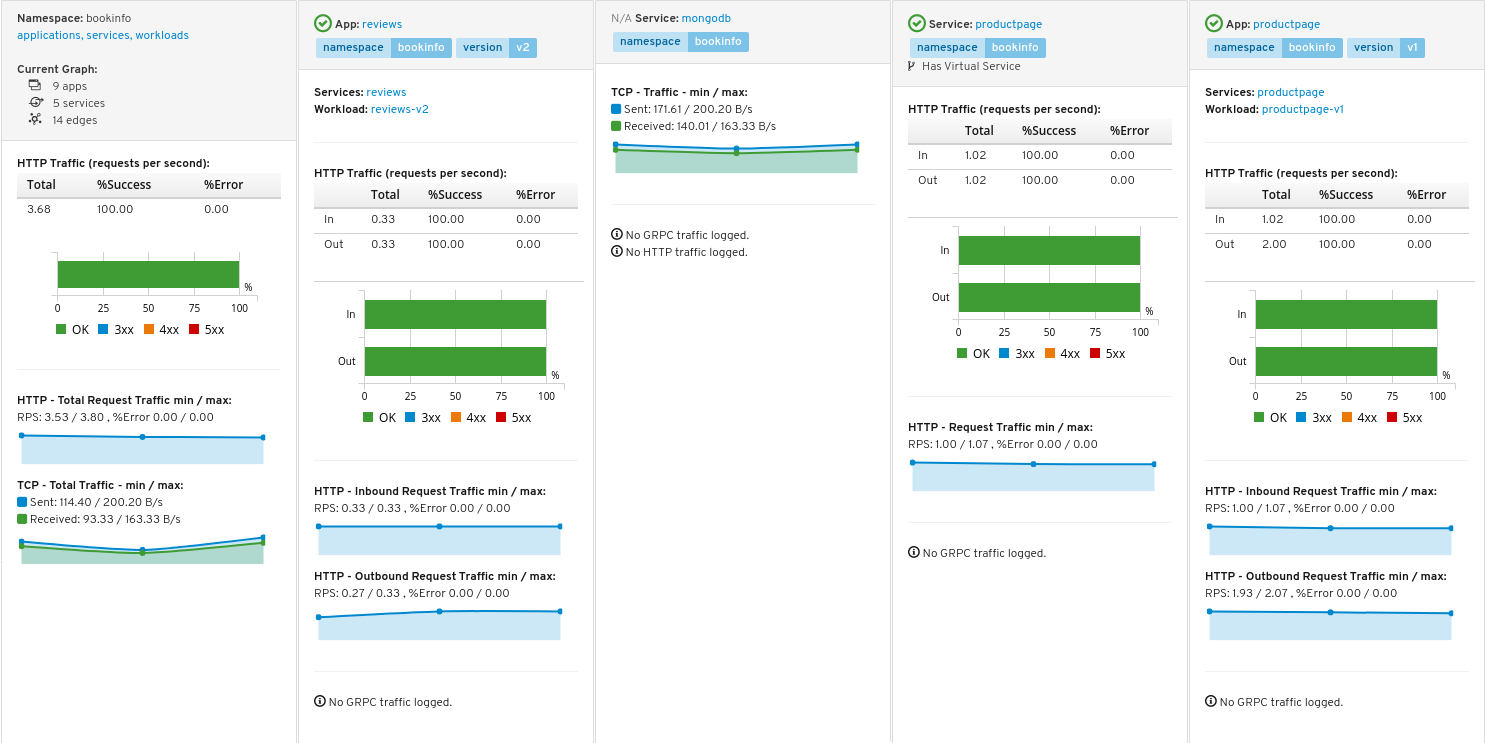
Graph: Side-Panel
Want to get a quick summary of anything in the graph? Select any node with a single-click and the side panel provides a brief summary for that component. This includes:
-
Charts showing traffic and response times
-
Health details
-
Links to fully-detailed pages
-
Response Code breakdowns.
Or, click the graph background and the side panel to view an overall summary for the entire graph.
Graph: Traffic Animation
Kiali offers several display options for the graph, including traffic animation.
For HTTP traffic, circles represent successful requests while red diamonds represent errors. The more dense the circles and diamonds the higher the request rate. The faster the animation the faster the response times.
TCP traffic is represented by offset circles where the speed of the circles indicates the traffic speed.
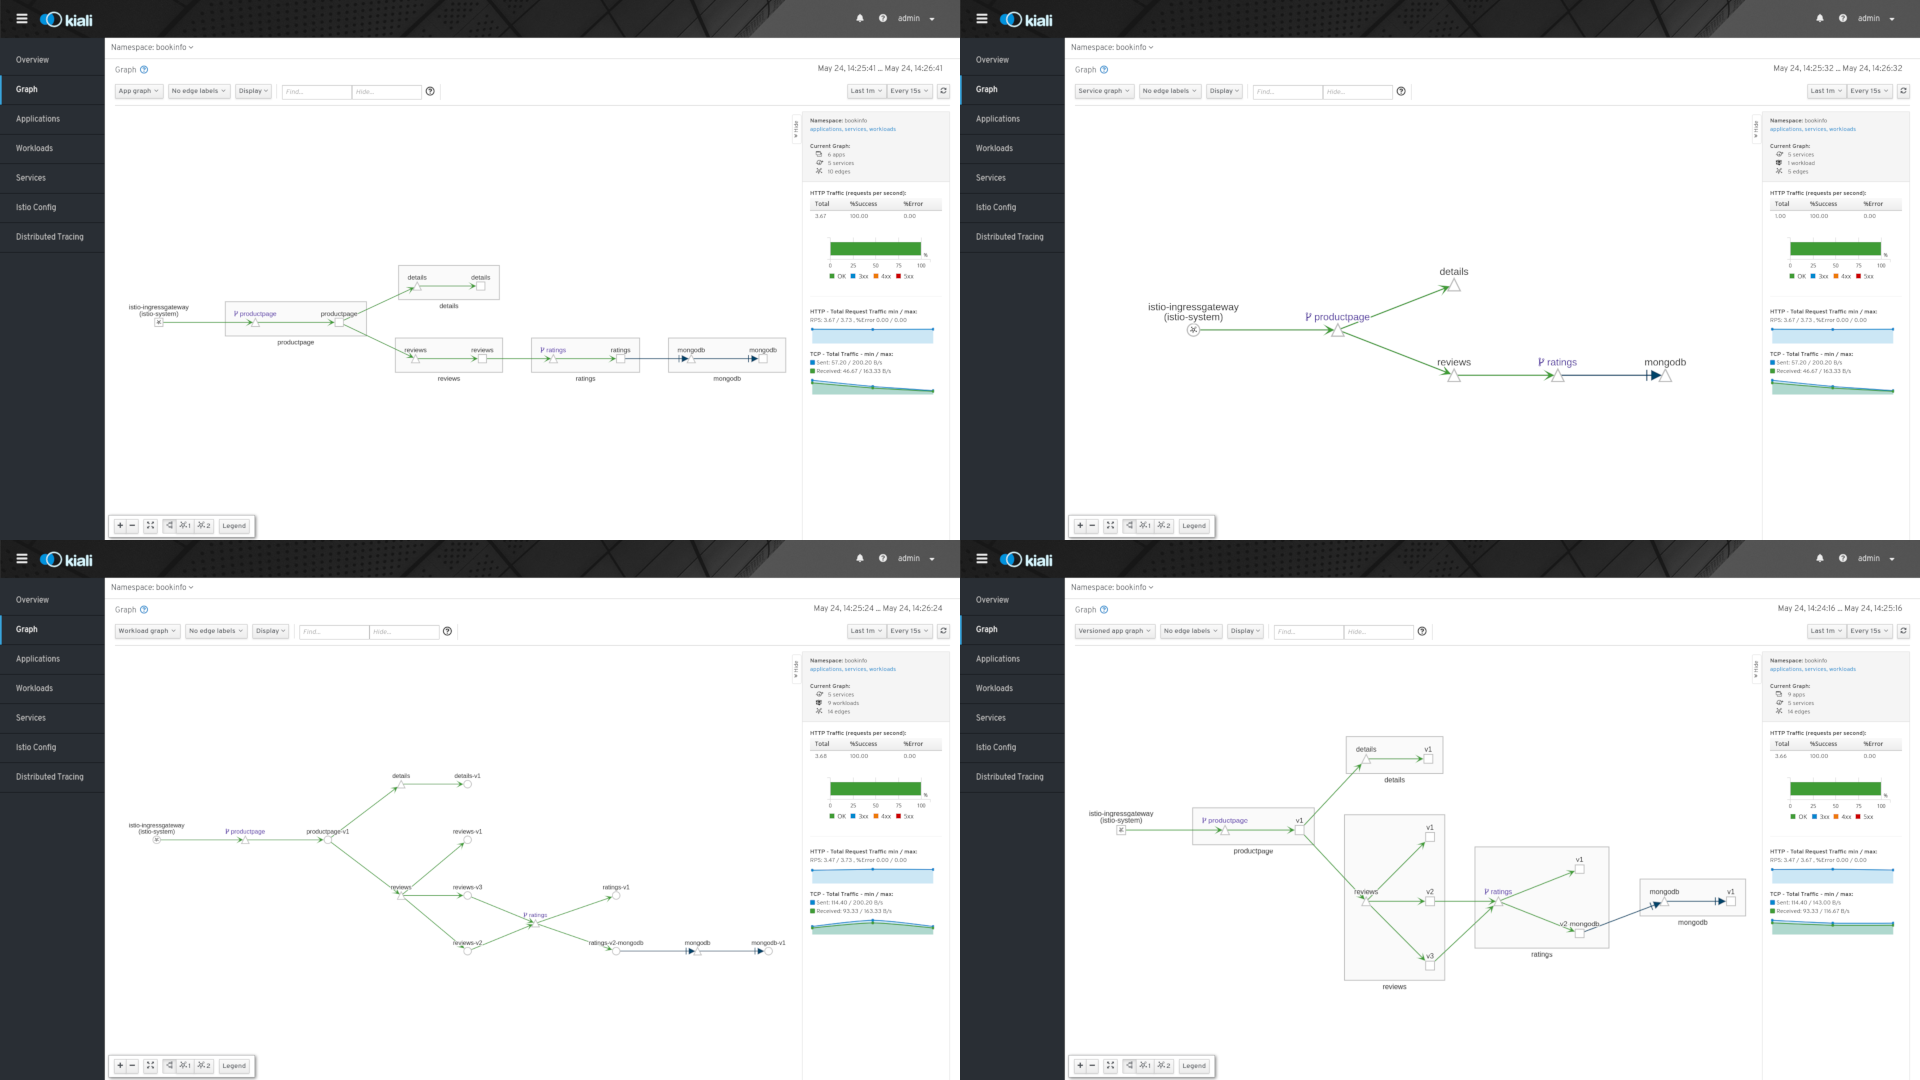
Graph: Graph Types
Kiali offers four different graph renderings of the mesh telemetry. Each graph type provides a different view of the traffic.
-
The workload graph provides the a detailed view of communication between workloads.
-
The app graph aggregates the workloads with the same app labeling, which provides a more logical view.
-
The versioned app graph aggregates by app, but breaks out the different versions providing traffic breakdowns that are version-specific.
-
The service graph provides a high-level view, which aggregates all traffic for defined services.
Detail Views
Kiali provides filtered list views of all your service mesh definitions. Each view provides health, details, YAML definitions and links to help you visualize your mesh. There are list and detail views for:
-
Services
-
Applications
-
Workloads
-
Istio Configurations (Virtual Services, Gateways, etc)
Detail: Metrics
Each detail view provides predefined metric dashboards. The metric dashboards provided are tailored to the relevant application, workload or service level.
Application and workload detail views show request and response metrics such as volume, duration, size, or tcp traffic. The traffic can also be viewed for either inbound or outbound traffic.
The service detail view shows request and response metrics for inbound traffic.
Detail: Services
The service detail view shows the user the workloads running the service. It also shows the Istio traffic routing configuration, VirtualServices and DestinationRules, associated with the service.
Kiali provides access to YAML definitions and allows modification and deletion access for authorized users. It provides wizards to assist in common configurations and performs additional validation on VirtualServices to detect misconfigured routes.
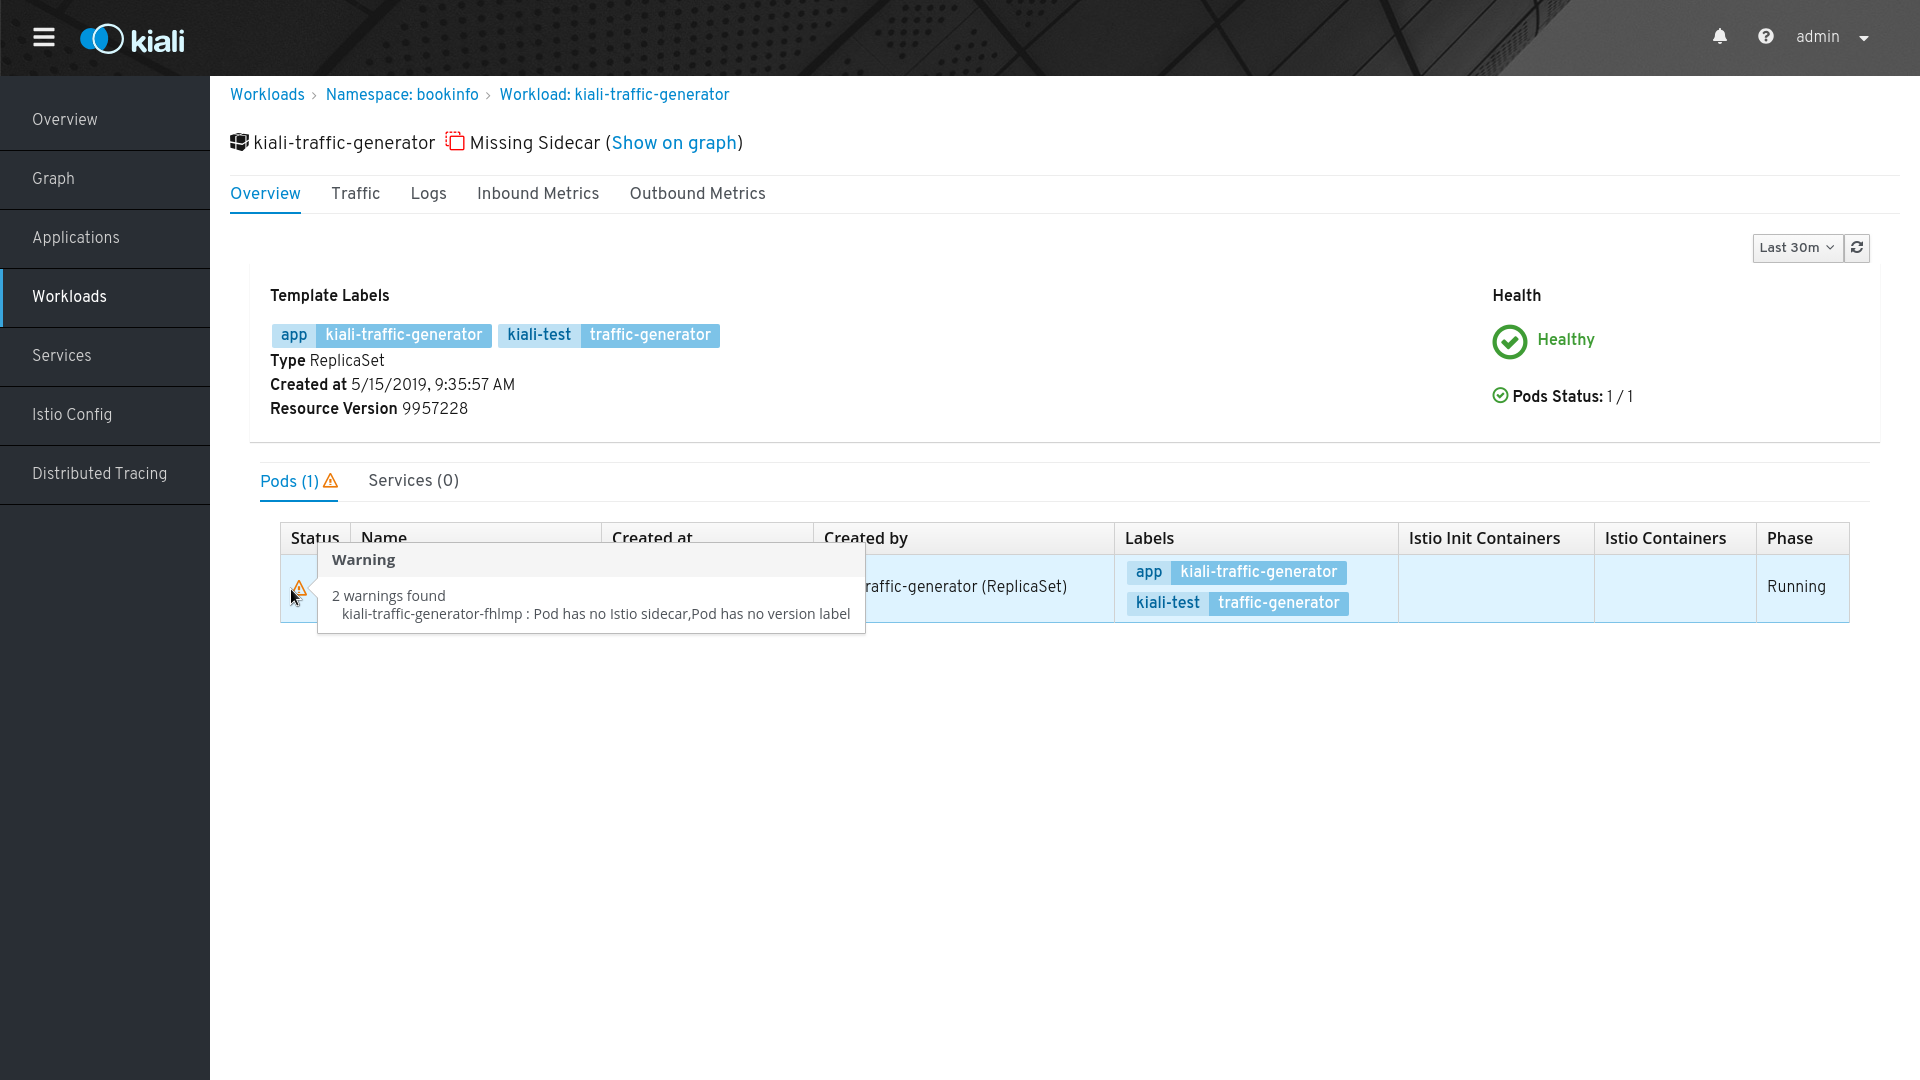
Detail: Workloads
Kiali performs several validations on workload configuration:
-
Are Istio sidecars deployed?
-
Are proper app and version labels assigned?
Workload detail shows you the services for which the workload is handling requests, and the pods backing the workload.
Workload detail also allows access to the pod logs, and provides detailed traffic breakdown.
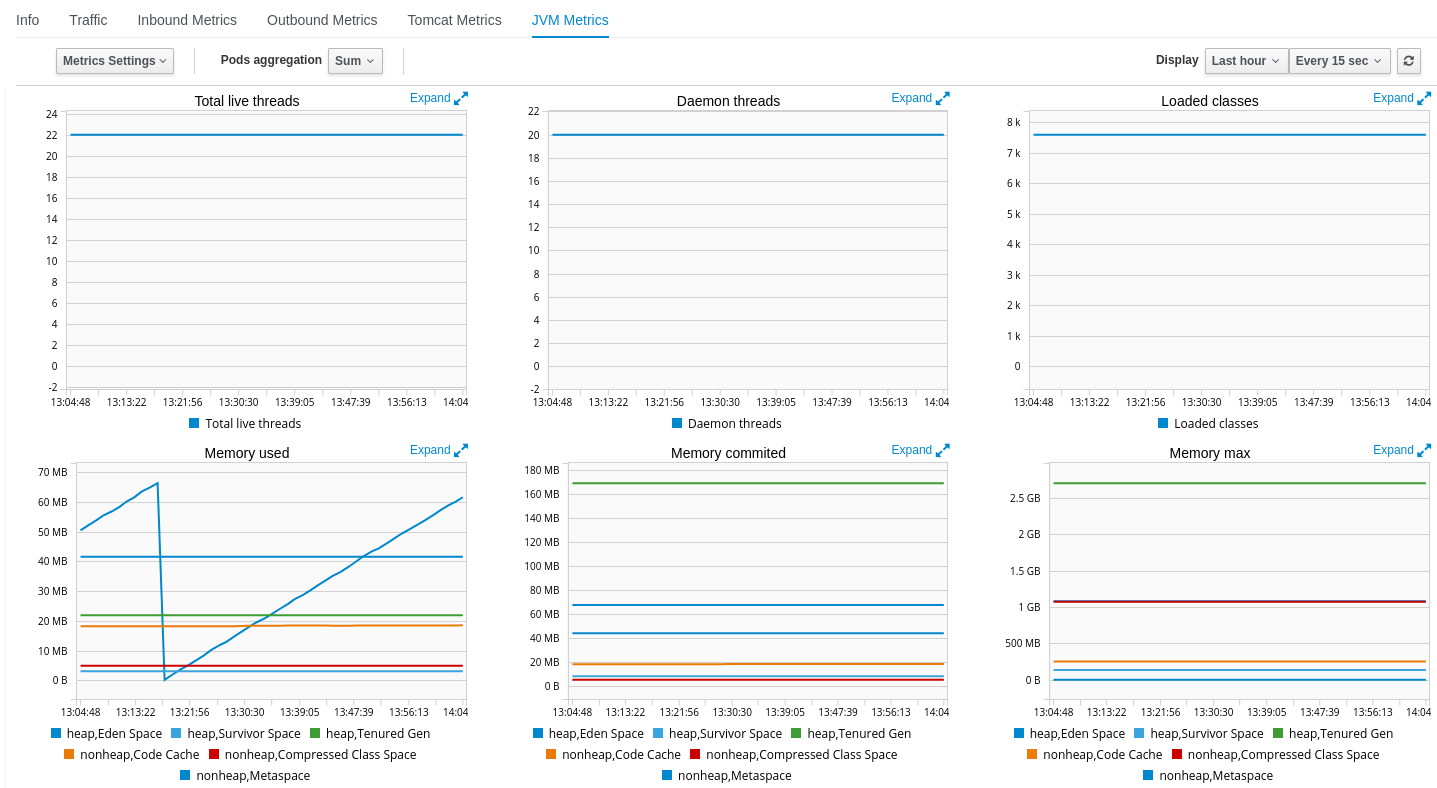
Detail: Runtimes Monitoring Dashboards
Kiali comes with default dashboards for several runtimes, including Go, Node.js, Spring Boot, Thorntail, and Vert.x.
These dashboards are simple Kubernetes resources, so you can use your favorite tool to create, modify or delete them. As they are defined as plain YAML or JSON files, so it’s easy to keep them in source control like Git, track their changes, and share them.
Check out the documentation page to learn more about it.
Configuration and Validation Features
Kiali is more than observability, it also helps you to configure, update and validate your Istio service mesh.
Istio Configuration
The Istio configuration view provides advanced filtering and navigation for Istio configuration objects such as Virtual Services and Gateways. Kiali provides inline config edition and powerful semantic validation for Istio resources.
Validations
Kiali performs a set of validations to the most common Istio Objects such as Destination Rules, Service Entries, and Virtual Services. Those validations are done in addition to the existing ones performed by Istio’s Galley component. Most validations are done inside a single namespace only, any exceptions, such as gateways, are properly documented.
Galley validations are mostly syntactic validations based on the object syntax analysis of Istio objects while Kiali validations are mostly semantic validations between different Istio objects. Kiali validations are based on the runtime status of your service mesh, Galley validations are static ones and doesn’t take into account what is configured in the mesh.
Check the complete list of validations for further information.
Istio Wizards
Kiali provides different actions to create, update and delete Istio configuration driven by wizards. These are located in the Actions menu on the Service Details page.

These actions are enabled by default.
Kiali can also be installed in view only mode to restrict any write operation on Istio configuration.
Check Kiali Operator CR to get more details about how to configure this option.
Weighted Routing Wizard
With this wizard, you can select the percentage of traffic that is routed to a specific workload.

Kiali creates a pair of Istio resources, VirtualService and DestinationRule, with a single routing rule using the selected weights for the destination workloads.
Matching Routing Wizard
The Matching Routing Wizard allows to create multiple routing rules.
-
Every rule is composed by a Matching and a Routes section.
-
The Matching section can add multiple filters using HEADERS, URI, SCHEME, METHOD or AUTHORITY Http parameters.
-
The Matching section can be empty, on this case, any http request received is matched against this rule.
-
The Routes section can select one or multiple Workloads.
Istio applies routing rules in order, meaning that first rule that matches an HTTP request, it is responsible to perform the routing. The Matching Routing Wizard allows to change order of rules.
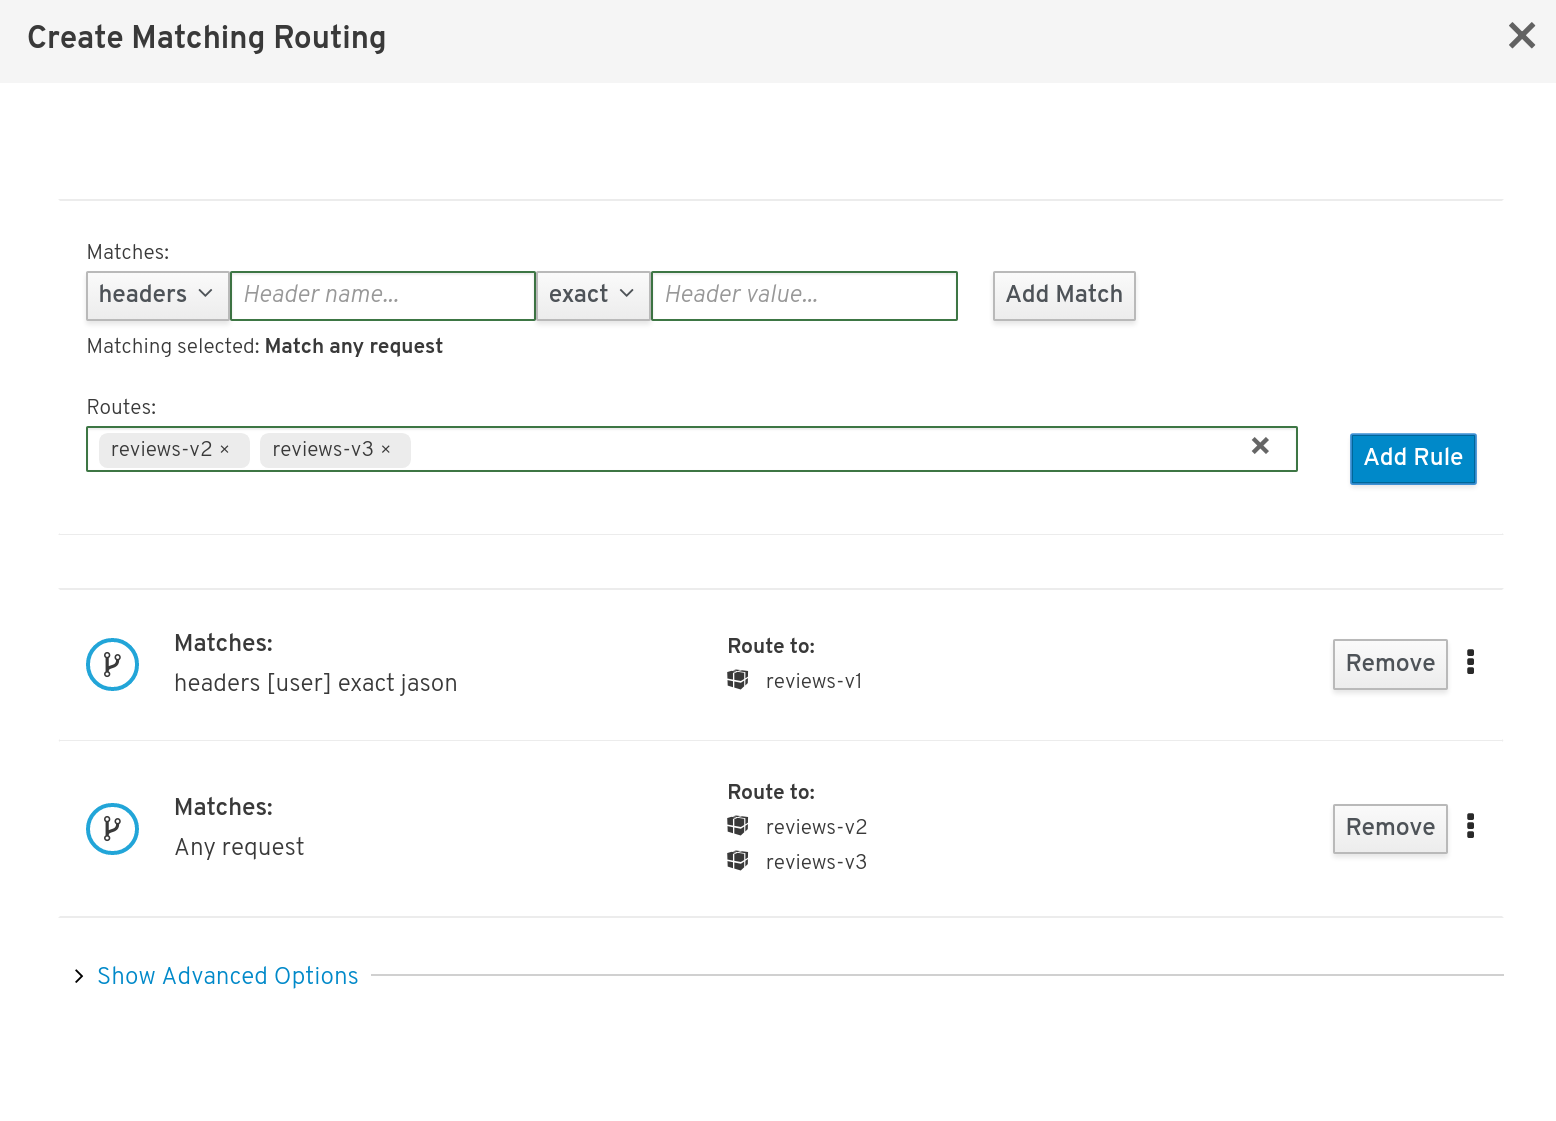
In the same way as the previous wizard, Kiali creates a pair of Istio resources mapping the routing rules defined into the generated VirtualService.
Suspend Traffic Wizard
This wizard helps user to partially or totally stop traffic for a service. You can define which workloads receive traffic.
When traffic is suspended for all workloads, Istio returns an error code to any service request.
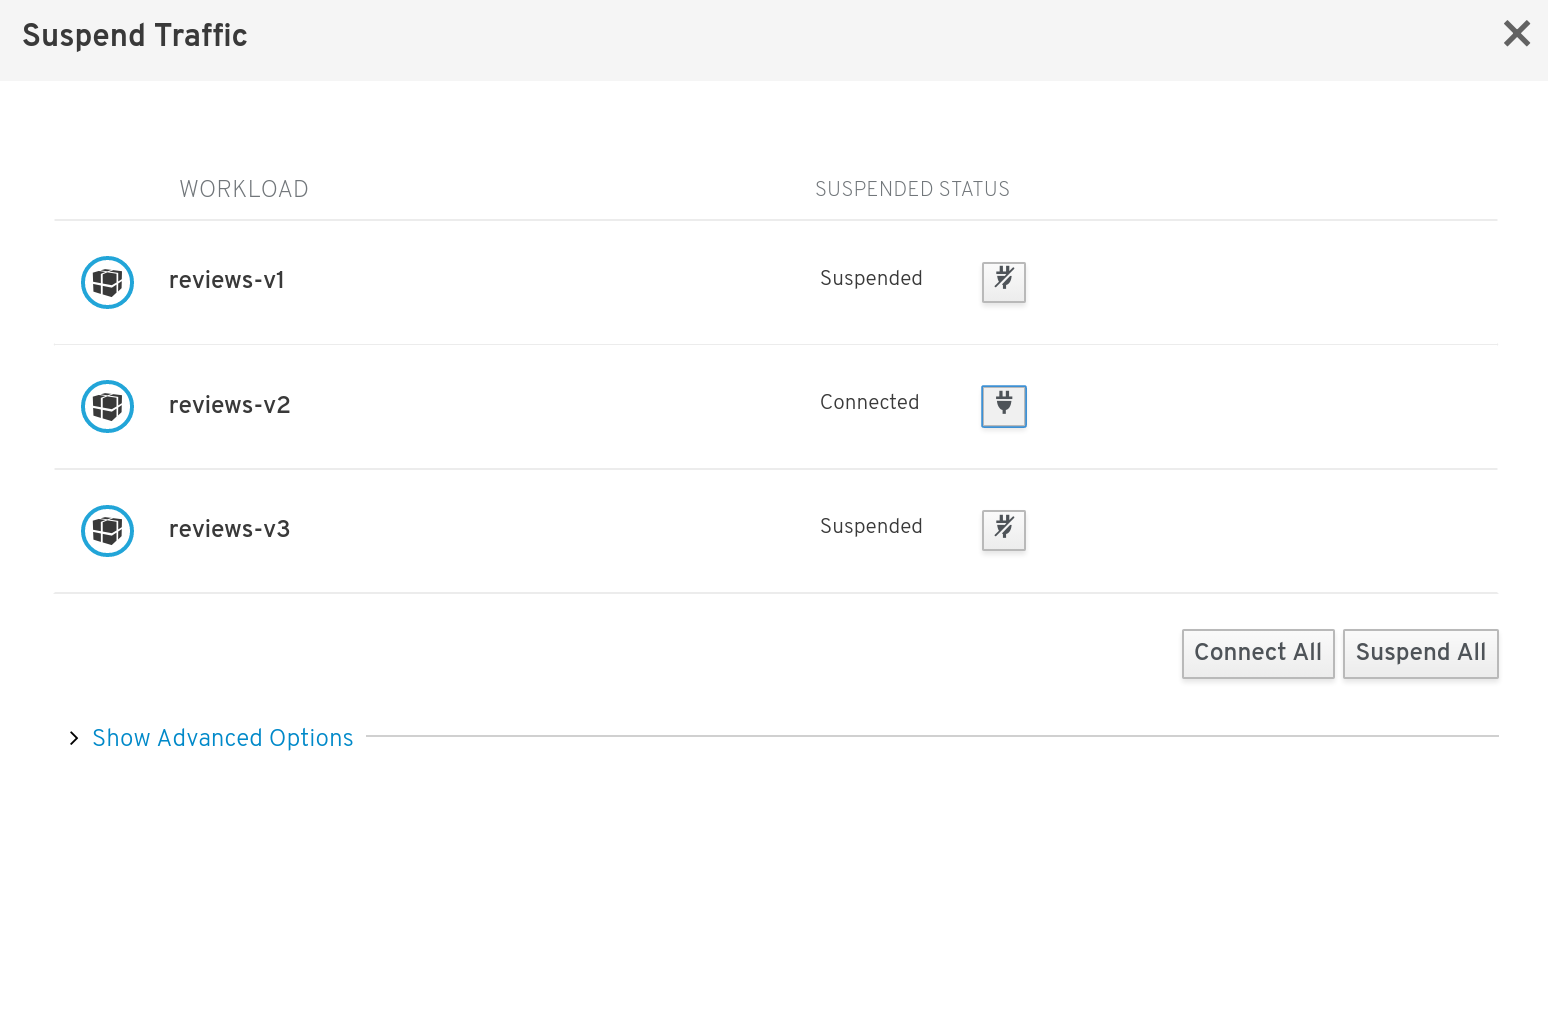
When there is traffic for some workload, the wizard maps a weighted rule; when there is not traffic, an abort rule is coded in the pair of Istio resources VirtualService and DestinationRule generated.
Advanced Options
All previous wizards have an Advanced Options section where user can define specific configuration for TLS and LoadBalancing.
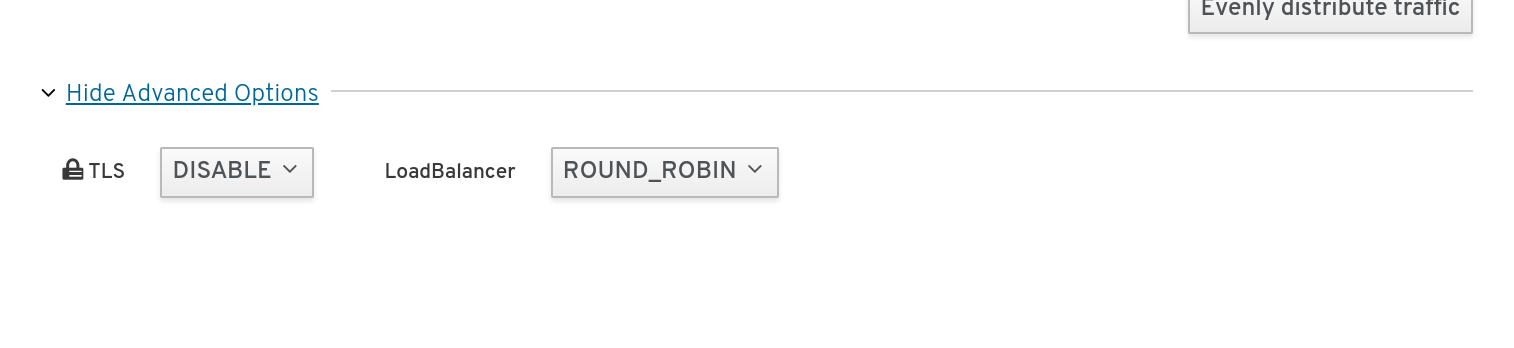
When mTLS is enabled by default in the global cluster or namespace this option is selected by default.
More Wizard examples
The following article Kiali: Observability in Action for Istio Service Mesh describes more examples of how to use the Kiali Wizards to configure Istio configuration.
Multi-cluster support
Istio provides installation instructions for three different multi-cluster scenarios: replicated control planes, shared control plane with single-network, and shared control plane with multi-network.
Currently, Kiali only works with Istio’s replicated control planes scenario. You will need to install Kiali aside each Istio’s control plane; i.e. you will need one Kiali instance per Istio’s control plane you want to monitor. Install instructions for Kiali are the same as for the single cluster scenario, so following the Getting started guide is enough. Kiali will let you observe the mesh portion that is managed by the adjacent control plane.
The shared control plane scenarios are currently not supported by Kiali.