Distributed Tracing
Kiali shows tracing of your applications. We currently support Jaeger version 1.9 and newer (Read docs).
To embed Jaeger, you must have the same protocol in Kiali and Tracing service.
1. Kiali and Tracing Service have the same protocol
When Kiali and Tracing service have the same protocol, we’ll have the embedded feature in the website.
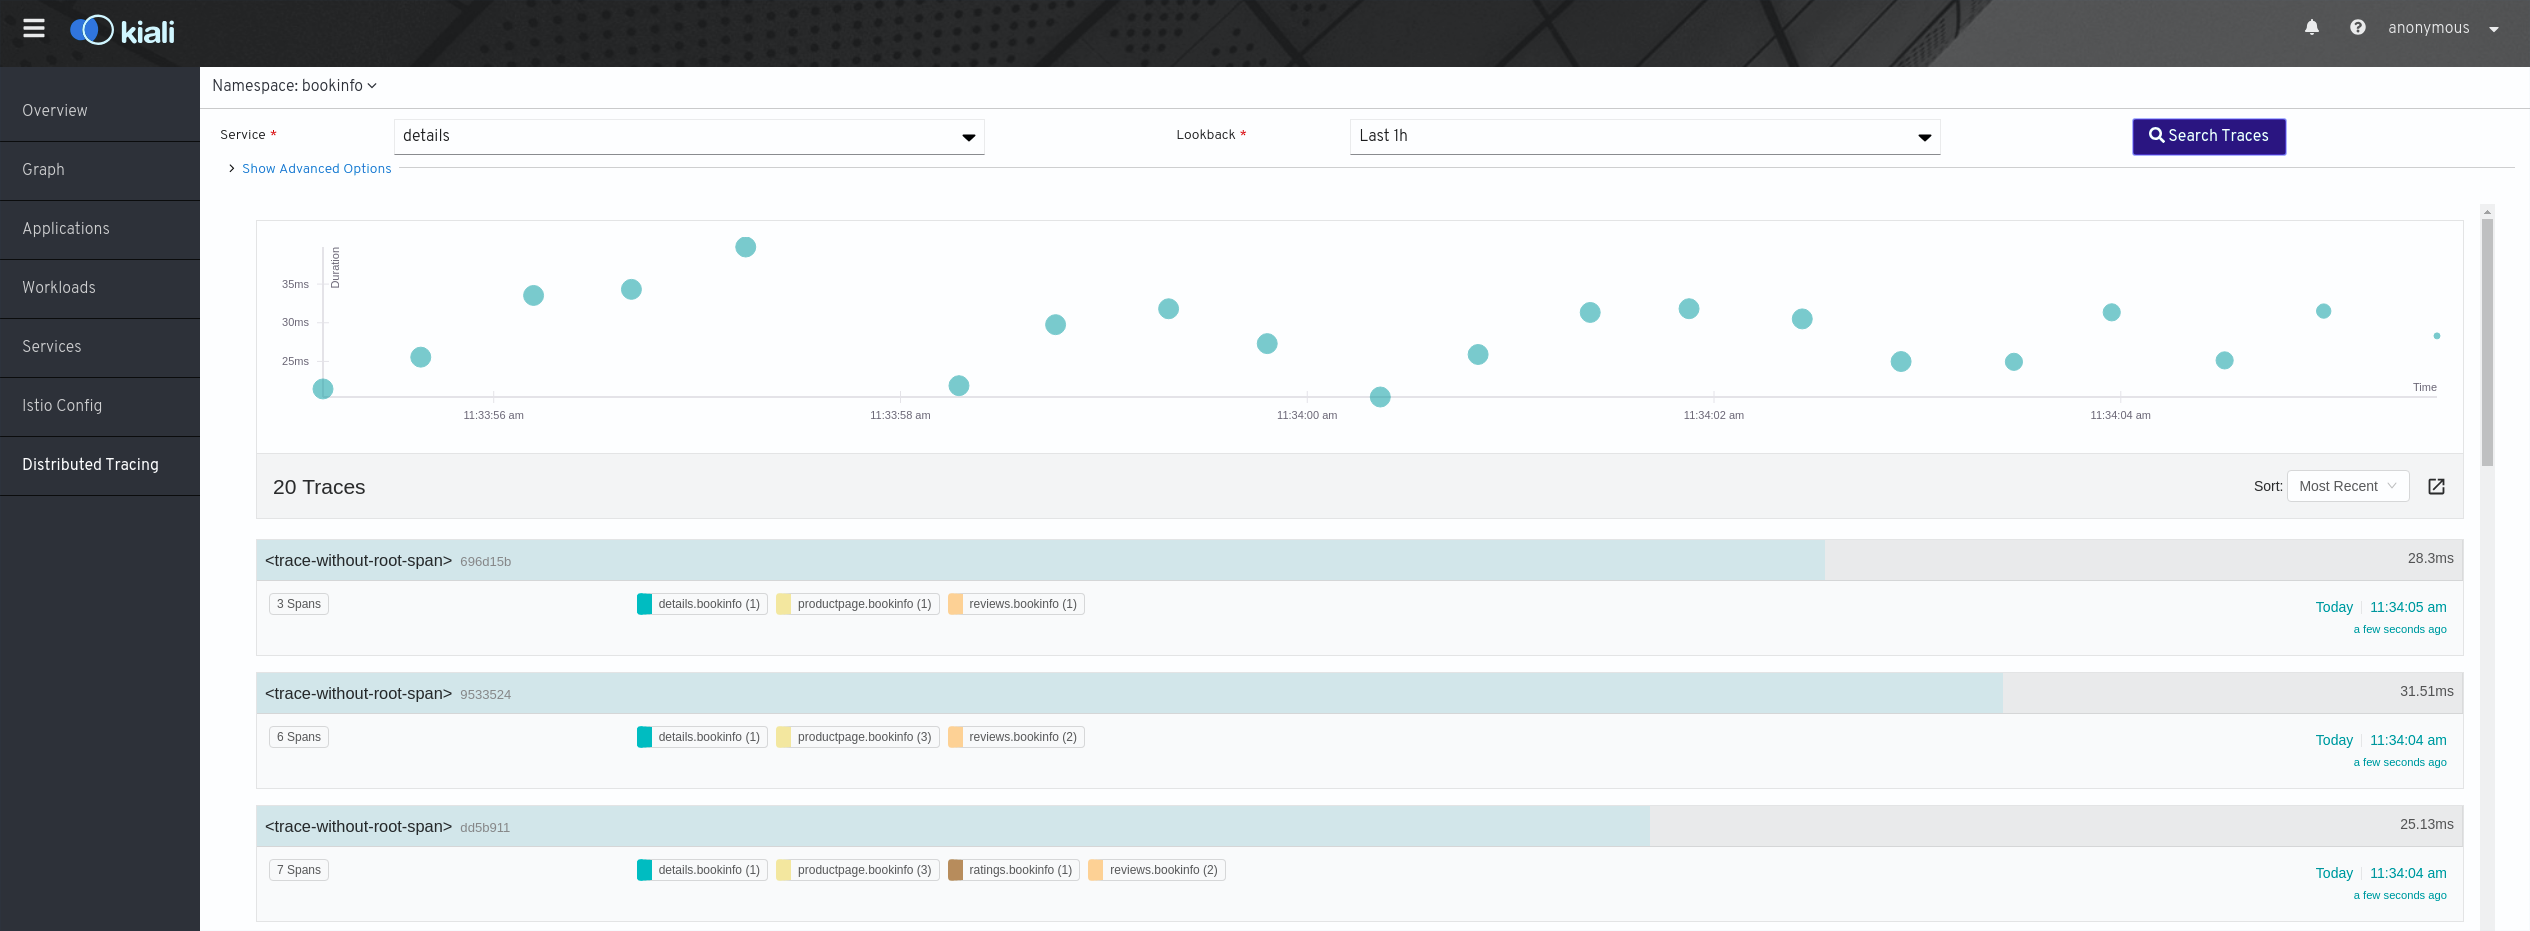
In the Distributed Tracing link in the menu we can see a full view for search the traces of our services.
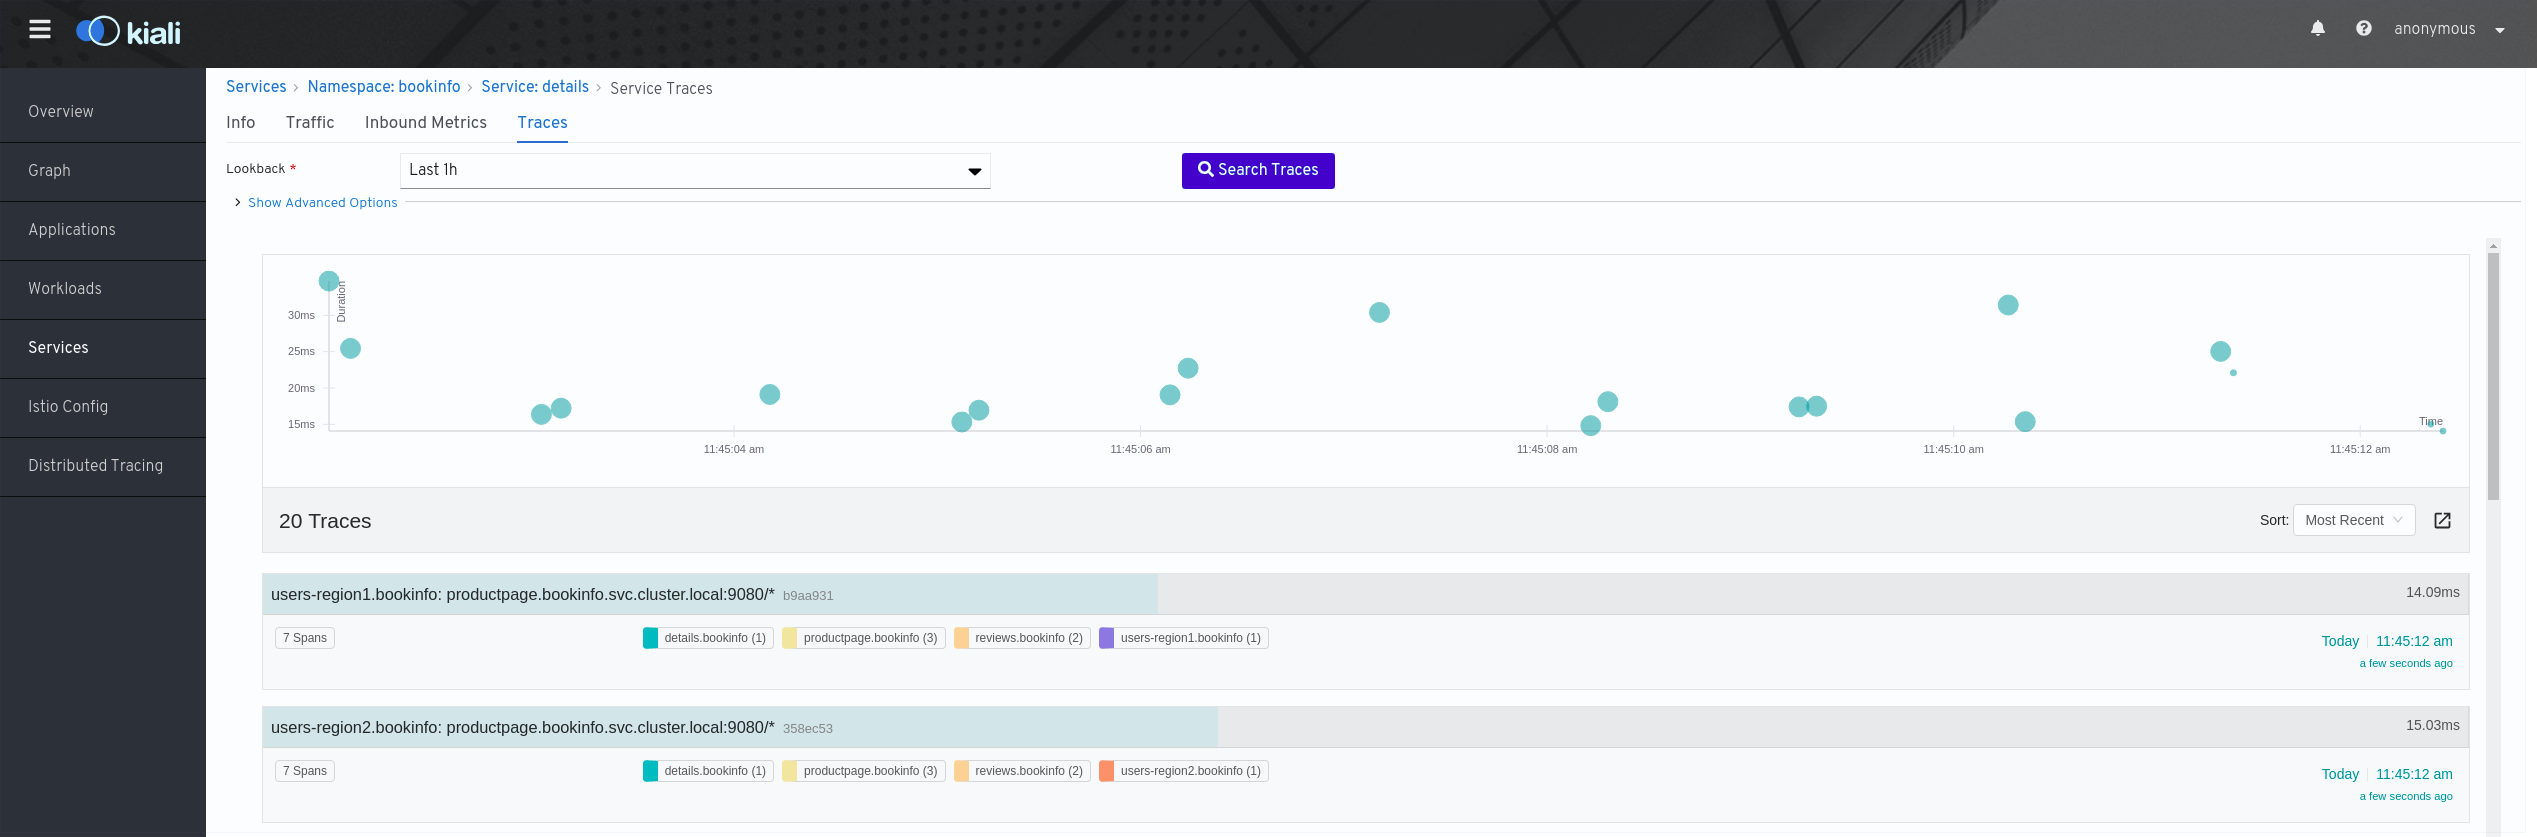
In each service we’ll have a new tab to display the traces for the service. (If we have error traces this tab will display them)
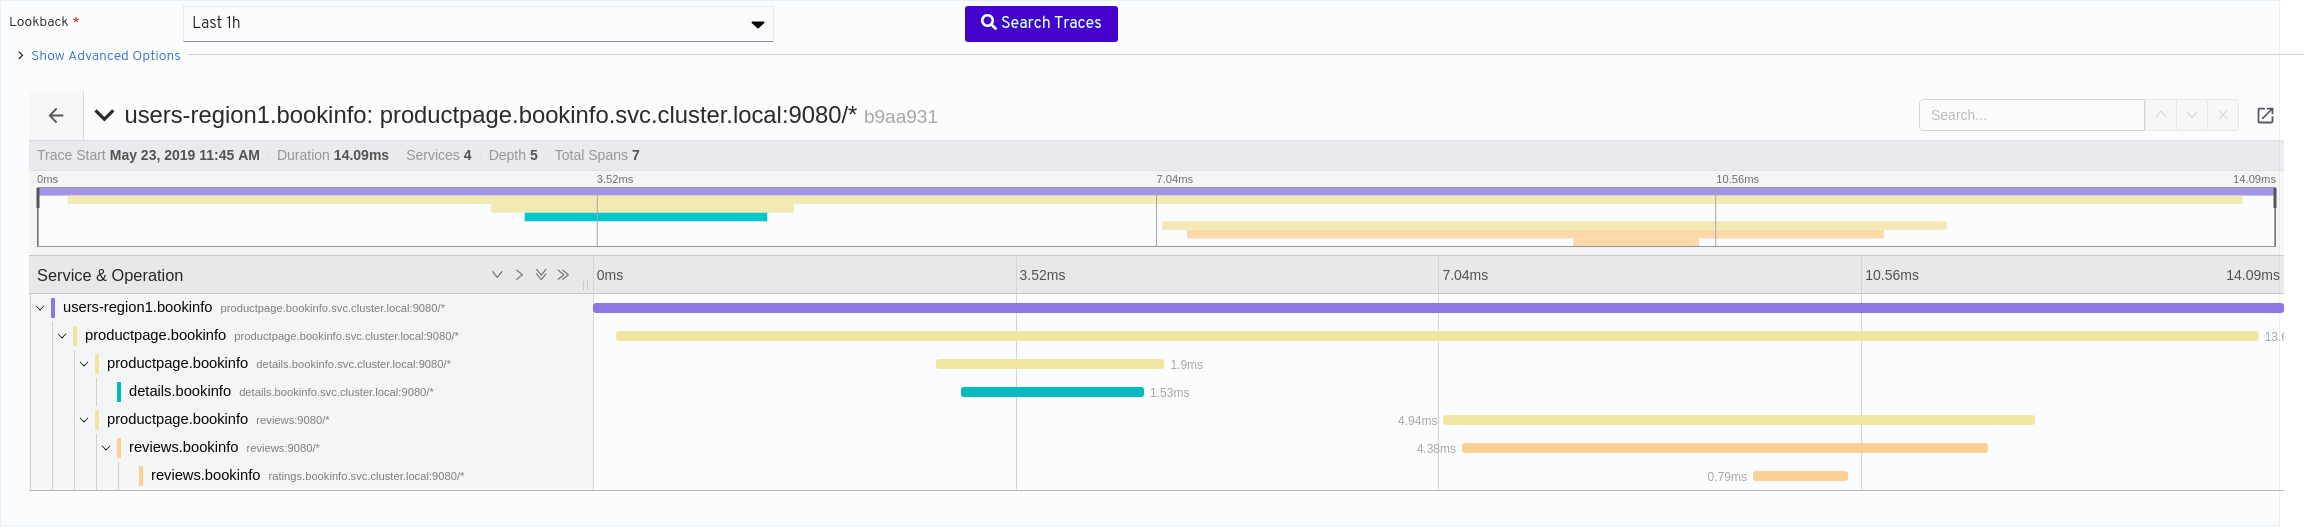
We can interact with this embedded feature like the Jaeger UI
1.1. Tracing Toolbar
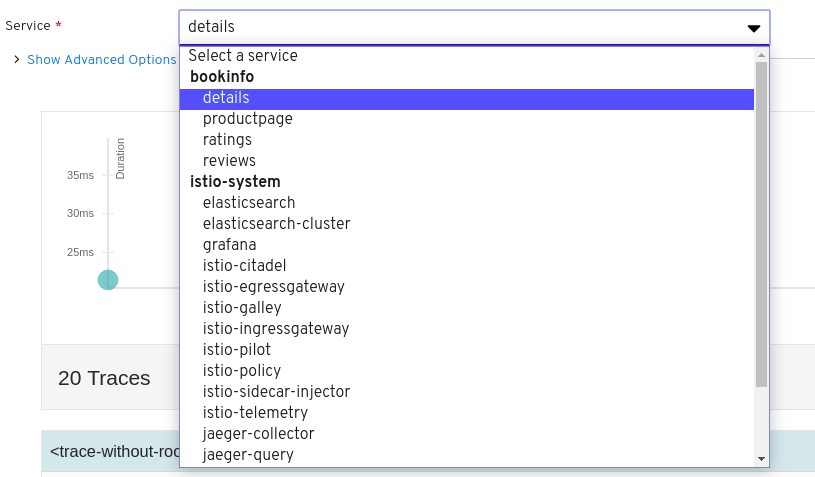
Kiali have a toolbar to control this feature to facilitate the user experience with the tracing service. When we go to the tracing view we’ll see a small form as the image below where we can select the service and the lookback(Traces from last minutes or hours).

The service selector has the list of services of the selected namespaces organized by namespace.
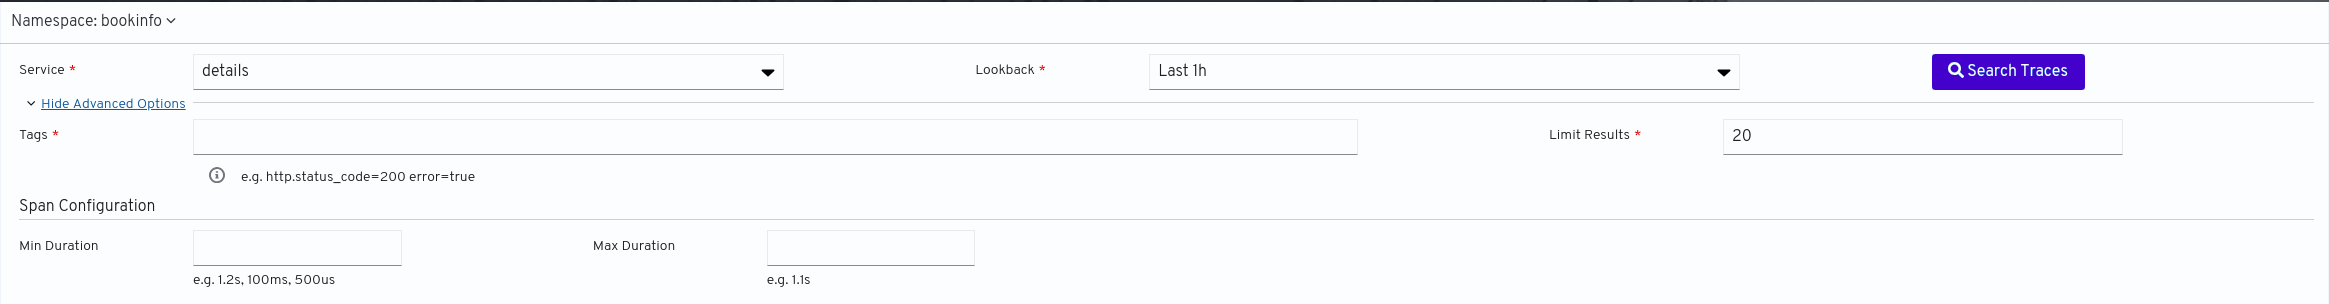
For an advanced search of traces we can expand the "Show advanced options."
-
Tags: Empty by default, find the traces with these values. Example:
http.status_code=200,error=true` -
Limit results: 20 by default, number of traces results.
-
Span Configurations (More info about spans here)
-
Min Duration: Min duration for a span. Eg: 1.2s, 100ms, 500us
-
Max Duration: Max duration for a span. Eg: 1.2s, 100ms, 500us
-
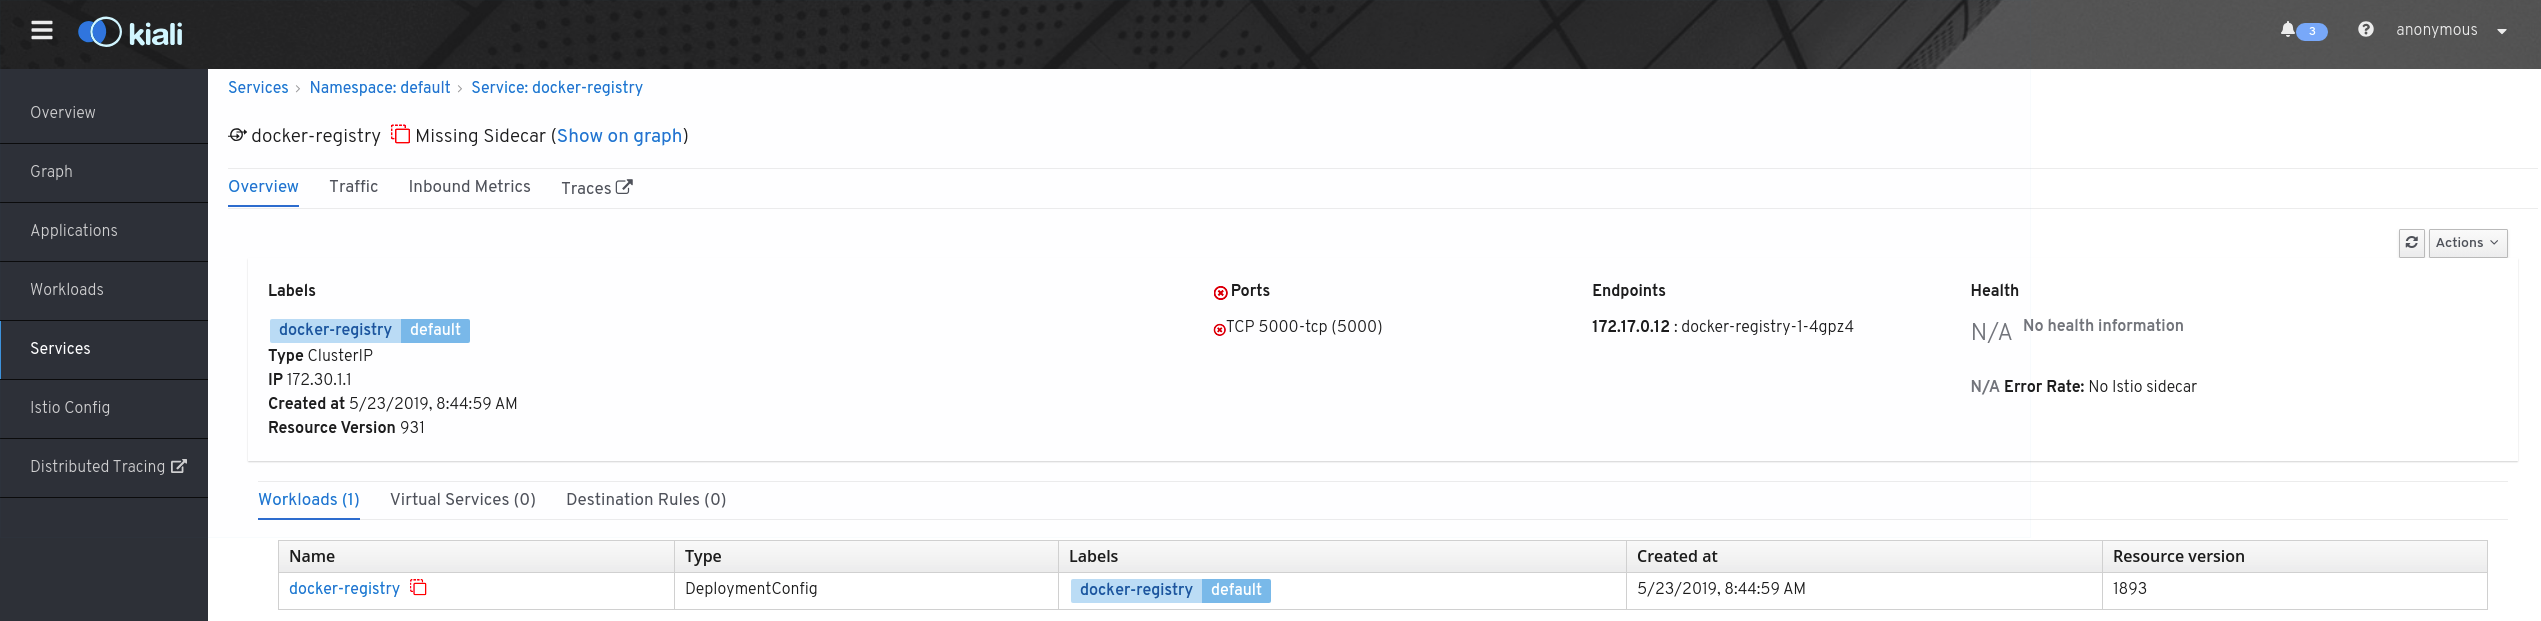
2. Kiali and Tracing Service have not the same protocol
In this case you’ll have a link to open the service in a new tab in your browser in the menu of Kiali and in the view of a specific service.